Quantcast
Channel: DevExpress Data Blog
Viewing all 61 articles
Browse latest View live

CodeMash / Michigan Tour Recap

$
0
0

Mehul and I had a great time at this year's Codemash conference held in Sandusky, Ohio Jan.11-13! We want to thank  the organizers for another amazing conference, as usual they were fantastic hosts.  We had a blast at our booth giving away lots of swag like t-shirts and bags and also gave away  copies of Visual Studio Ultimate to two very lucky attendees.  It was awesome. 

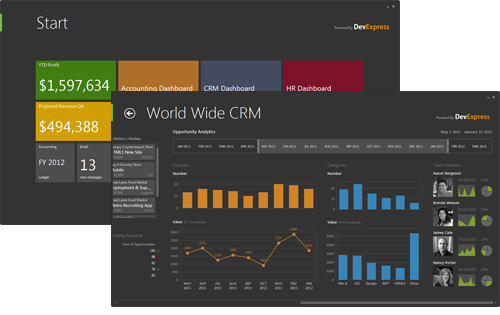
And, if you know me, you know I love to talk and spread the word about DevExpress so the Codemash folks kindly  let me present a mini session about making stylish Metro inspired applications today. Here is a good screenshot:

DevExpress CRM Metro Inspired Demo

I love data analysis and therefore am enjoying our push to liven your data very much. I also had the privilege of reminding folks about our free WPF map offer! I showed off how easy it is to add that elusive extra dimension to your data.

In addition to CodeMash, Dave Giard invited me to talk at several Michigan user groups.  So I left Ohio behind and forged  my way around the southern part of the state from the Greater Lansing .NET UG to Kalamazoo's Microsoft Developers of Southwest Michigan UG, Southfield's  Great Lakes Area .NET UG and finally the Ann Arbor .NET Developer's Group. I had a chance to meet a lot of cool developers and customers doing great things. Thanks for having me everyone, it was a pleasure!

I had the privilege of talking about a wide range of topics in C#, AI, and Machine Learning to name a few. Michigan is a wonderful state and I hope I have the privilege of being welcomed again.

Looking forward to next year's CodeMash which is already scheduled for Jan.9-11, 2013.

As always, if there are any comments and/or questions, feel free to get a hold of me!

Seth Juarez
Email: sethj@devexpress.com
Twitter: @SethJuarez

Want The Best Reporting Tool Ever?

Get The No-Compromise Reporting Tool for WinForms, ASP.NET, Silverlight and WPF! - Native integration with DevExpress WinForms and ASP.NET Controls, unequalled design-time productivity, industrial-grade features. Try a fully-functional version of DXperience for free now: http://www.devexpress.com/Downloads/NET/

Let us know what you think of our Reporting Suite by rating it in the VS Gallery!

Follow SethJuarez on Twitter


Exciting New 12.1 Reporting Features – Custom Report Templates

$
0
0

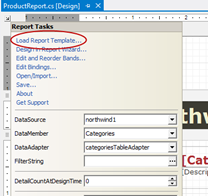
Report Smart TagIn 11.2 we quietly released a fantastic feature which enabled report users to quickly and easily load predefined report templates. These templates are an initial stepping stone into full fledged reporting as they powerfully demonstrate how one could develop any style of report. This feature can be easily activated by creating a new report and accessing the report smart-tag. In the smart tag you will notice a couple of interesting new options. These options are “Load Report Template” and “Edit Bindings".” The first option will, by default, load a set of predefined templates that we’ve created at DevExpress to show you some of the capabilities of our fantastic reporting suite. Because these templates were created with different data shapes, the Edit Bindings command allows you to edit these in a simple and easy to use interface.


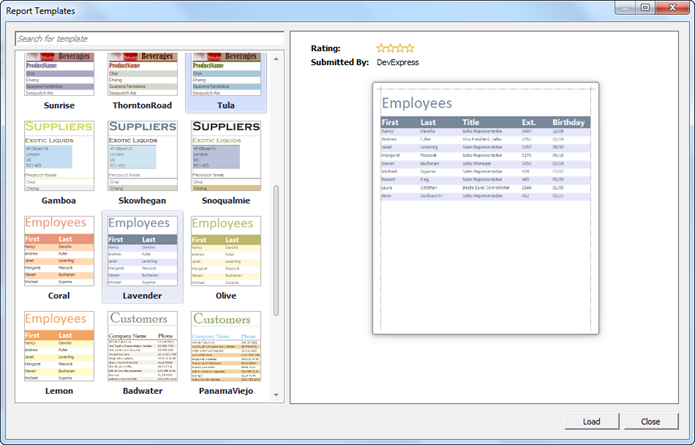
Below is what one would see if they were to use our reporting templates:

DevExpress Report Templates

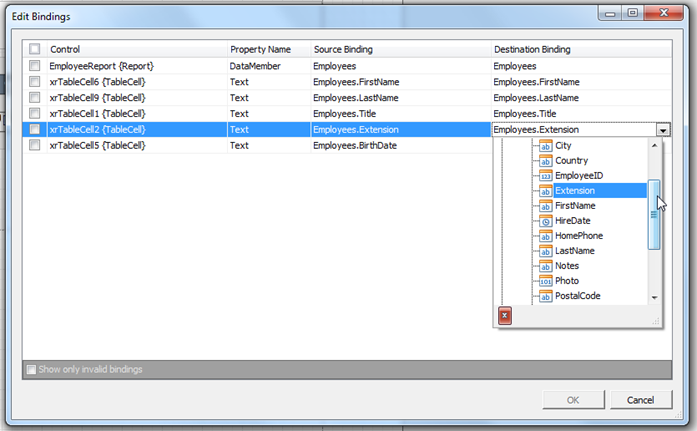
The “Edit Bindings” feature (new in 12.1) is an easy way to re-map each of the bindings defined in the template:

Report Template Binding Editor

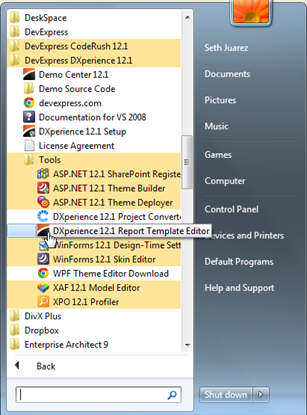
The question now becomes “how do I make my own templates?” 12.1 also saw the release of a brand new template-extractor-like tool called the Report Template Editor:

Windows Start and Report Template Editor

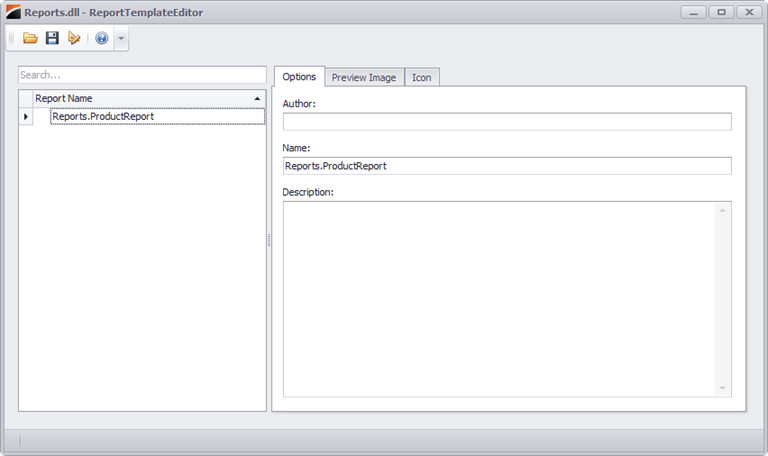
This tool will extract any and all report styles from existing report objects (within assemblies) as well as persisted report layouts:

Report Template Editor

This tool additionally comes with the ability to edit the template in preparation for packaging.

In the next installment of our foray into the report template features available in 12.1, I will discuss how you can enable the use of your custom templates as a means of getting your end users up and running with an appropriately styled report within the End User Report Designer. I think it is absolutely fantastic stuff!

As always, if there are any comments and/or questions, feel free to get a hold of me!

Seth Juarez
Email: sethj@devexpress.com
Twitter: @SethJuarez

Want The Best Reporting Tool Ever?

Get The No-Compromise Reporting Tool for WinForms, ASP.NET, Silverlight and WPF! - Native integration with DevExpress WinForms and ASP.NET Controls, unequalled design-time productivity, industrial-grade features. Try a fully-functional version of DXperience for free now: http://www.devexpress.com/Downloads/NET/

Let us know what you think of our Reporting Suite by rating it in the VS Gallery!

Follow SethJuarez on Twitter

Custom Report Templates – Using In-House Templates

$
0
0

In our previous write-up we chatted about report templates in general as well as how to create them. I wanted to spend a few minutes (as promised) to show you how to use your own templates within your applications as a means to assist end users to get up and running with internal reporting. Oftentimes companies have the same stylistic and structural elements across their large set of reports. In other words, when someone tells me they have hundreds of reports they really have a smaller set of “base” reports that contain a certain aesthetic and structure to them. Whenever your end users want to create a new Product report, for example, what they really mean is that they want to create a variation on an existing product report. When end users are confronted with a blank report they will often use the developers as a safety valve to help them get started. Instead of constantly facing that endless time sink-hole, why not present them with a dialog that has your basic reports and let the users chose from that set.

templates

How hard is this to do then? It is truly quite simple and can be accomplished in two simple steps:

  1. Create a report template extension by inheriting from the ReportTemplateExtension class
  2. Register the extension

Once these two steps are complete, your custom end user report designer will show the “Load Report Template” link that…

load

The Code

The first step mentioned was creating a descendant of the ReportTemplateExtension abstract class. This is implemented by overriding the GetTemplates( ) function. You are truly free to retrieve the templates from whatever storage medium you see fit. In this instance I simply have all of the templates tucked away into a Templates folder.

public class CustomTemplate : ReportTemplateExtension
{
    public override IEnumerable<Template> GetTemplates()
    {
        var archive = new TemplateArchiveManager();
        string path = Path.Combine(Application.StartupPath, "Templates");
        var files = Directory.GetFiles(path);

        var templates = new List<Template>(files.Length);

        foreach (string file in files)
            using (Stream stream = new MemoryStream(File.ReadAllBytes(file)))
                templates.Add(archive.GetTemplatesFromArchive(stream));

        return templates;
    }
}

The second step was to register the extension with the reporting system. This is easily done with the following line of code:

ReportTemplateExtension.RegisterExtensionGlobal(new CustomTemplate());

This should be done when the application first starts.

That should do it! In two simple steps we can now enable our end users to quickly and easily get started with reports with custom templates. I would love to see how this feature is used!

As always, if there are any comments and/or questions, feel free to get a hold of me!

Seth Juarez
Email: sethj@devexpress.com
Twitter: @SethJuarez

Want The Best Reporting Tool Ever?

Get The No-Compromise Reporting Tool for WinForms, ASP.NET, Silverlight and WPF! - Native integration with DevExpress WinForms and ASP.NET Controls, unequalled design-time productivity, industrial-grade features. Try a fully-functional version of DXperience for free now: http://www.devexpress.com/Downloads/NET/

Let us know what you think of our Reporting Suite by rating it in the VS Gallery!

Follow SethJuarez on Twitter

Improved Parameter Support for Reports

$
0
0

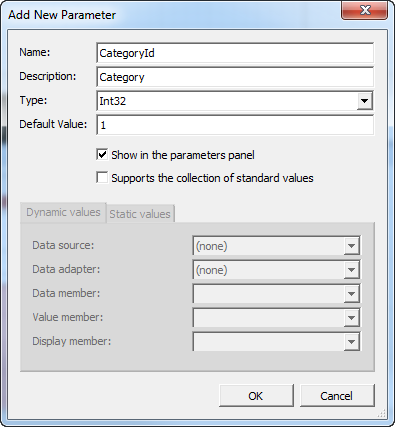
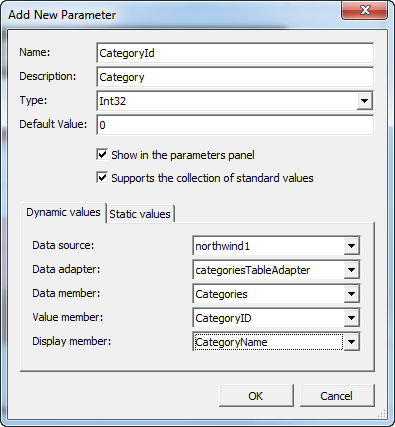
There were a number of gems recently added to our already fabulous reporting suite. One of the interesting ones was improved parameter support. Previously one could only create and expose parameters over integral types. A great example is filtering a report by a CategoryId. Before you would only be able to create a parameter of type int and have users type in numbers rather than category names. With our improved parameters dialog there are now additional options to choose from:

New Report Parameter Dialog

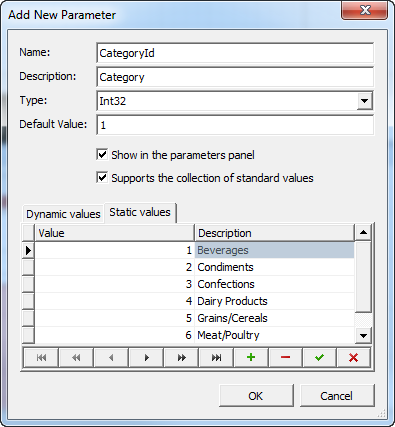
Once you check the “Supports the collection of standard values” checkbox you now have the ability to create a set of values that the parameter can take. These can be created either by a collection of static values or binding to a set of dynamic values.

Static Values

This option simply lets you define the set of available options manually.

Static Values in Report Parameter Dialog

The interface allows for the entry of the actual value passed as the parameter along with a description of what will be displayed.

Dynamic Values

Using dynamic values allows for binding to a set of key/value pairs to be displayed.

Dynamic Values in Report Parameter Dialog

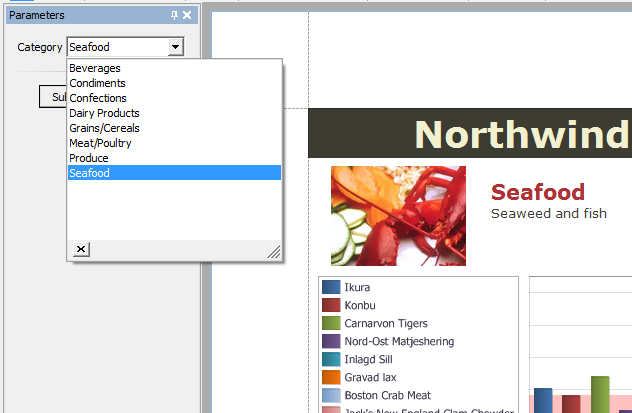
In this case we need to set the source of the data, how the data is retrieved, as well as the value and display members. At runtime both methodologies yield the following result:

Report Parameter Values in Report Preview

Now your users can choose from an intelligible list of options that are better suited to your user while dealing with the pieces of data (like an id number) your system likes in the background.

Wait, there’s more

The next question I will invariably get is this:

“But Seth, our reports are not bound to datasets with table adapters! Can I still have dynamic parameters?”

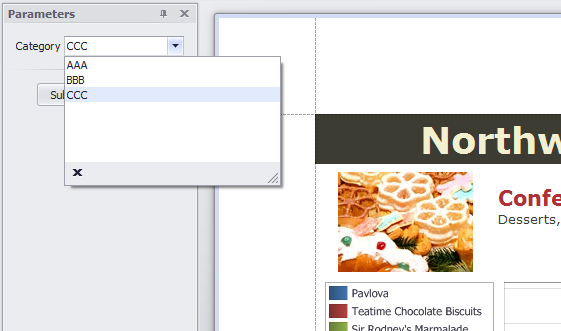
Of course! In this particular case the best course of action is to use a Static Values list. When doing the intial setup you can place any value to start. We can then take advantage of the ParametersRequestBeforeShow event to populate the static value list as we see fit:

private void ProductReport_ParametersRequestBeforeShow(object sender, ParametersRequestEventArgs e)
{
    if (CategoryId.LookUpSettings is StaticListLookUpSettings)
    {
        var lookup = (StaticListLookUpSettings)CategoryId.LookUpSettings;
        lookup.LookUpValues.Clear();
        lookup.LookUpValues.Add(
            new LookUpValue { Value = 1, Description = "AAA" }
        );

        lookup.LookUpValues.Add(
            new LookUpValue { Value = 2, Description = "BBB" }
        );

        lookup.LookUpValues.Add(
            new LookUpValue { Value = 3, Description = "CCC" }
        );
    }
}

This code is deliberately simple to show the possibilities. Here I am simply hand coding the available parameter options directly into the method. One could imagine a scenario where we make a service/database/foo call to retrieve the key/value pairs to subsequently populate the list. Running the previous code will result in the following:

Report Parameter Custom Values in Report Preview

This new addition to our reporting suite will definitely simplify our ability to help our end users consume dynamic reports.

As always, if there are any comments and/or questions, feel free to get a hold of me!

Seth Juarez
Email: sethj@devexpress.com
Twitter: @SethJuarez

Want The Best Reporting Tool Ever?

Get The No-Compromise Reporting Tool for WinForms, ASP.NET, Silverlight and WPF! - Native integration with DevExpress WinForms and ASP.NET Controls, unequalled design-time productivity, industrial-grade features. Try a fully-functional version of DXperience for free now: http://www.devexpress.com/Downloads/NET/

Let us know what you think of our Reporting Suite by rating it in the VS Gallery!

Follow SethJuarez on Twitter

DevExpress XAF Training in Germany

$
0
0
Häckers Kurhotel

One of the true unsung treasures DevExpress has developed is called XAF – Express Application Framework. I only recently became aware of the sheer power this framework while experimenting in a File->New Project type scenario. I was able to get  a full web and windows application done in a few minutes by appealing to its architectural strengths as well as its design-time flexibility. As soon as I got something to work, however, I realized that I had barely grazed the tip of the iceberg. The module based approach in XAF allows for an unlimited combination of added functionality.

As I started diving into the extensive1 documentation2 I realized that some hands on help would be in order. I started working with some of the developers of the system and saw my understanding increase exponentially.

One of those experts is, of course, Oliver Sturm! He is putting on a full 5 day class on XAF in Bad Ems, Germany. It is a beautiful little town about an hour outside of Frankfurt. I was there earlier this year and was impressed at what a lovely place it was! The class runs from November 19-23. More details can be found here.

I am seriously jealous! I am hoping I can attend simply because I want to learn more about this tremendous framework.

Expert DevExpress XAF
November 19-23 (5 days)
Häckers Kurhotel, Bad Ems, Germany
To sign up for this class, please send an email with your details. Their representative John Martin will get back to you as soon as possible!

As always, if there are any comments and/or questions, feel free to get a hold of me!

Seth Juarez
Email: sethj@devexpress.com
Twitter: @SethJuarez

Want The Best Reporting Tool Ever?

Get The No-Compromise Reporting Tool for WinForms, ASP.NET, Silverlight and WPF! - Native integration with DevExpress WinForms and ASP.NET Controls, unequalled design-time productivity, industrial-grade features. Try a fully-functional version of DXperience for free now: http://www.devexpress.com/Downloads/NET/

Let us know what you think of our Reporting Suite by rating it in the VS Gallery!

Follow SethJuarez on Twitter

Building Dashboards with DevExpress

$
0
0

In my very first post as a DevExpress employee I quoted Rutherford B. Rogers:

We're drowning in information and starving for knowledge.

It is indeed the case that our software produces a fair amount of data exhaust. Oftentimes this exhaust languishes in a database or set of files and services without providing value and while producing excess overhead. At DevExpress we are committed to turning your data exhaust into valuable and actionable information that will enable your clients to be more productive and give meaningful insight into the key metrics that drive their business.

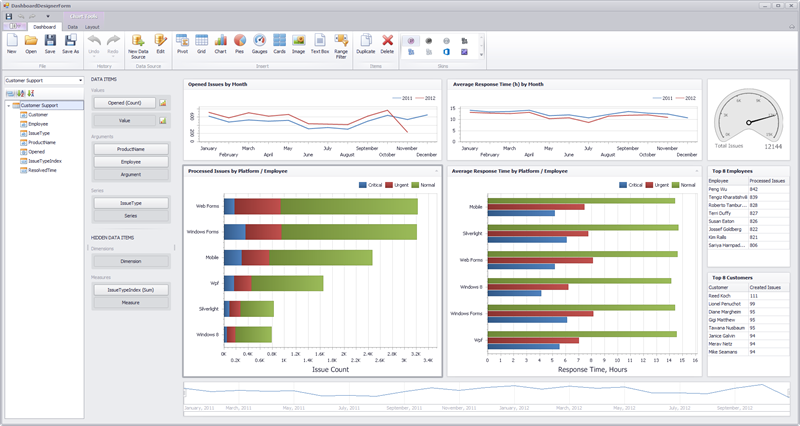
With that, we are excited to introduce a brand new dashboard tool to our already powerful family of data rich components. This tool is intended to help you build and distribute interactive data visualizations with ease.

Dashboard Designer


Data

One of goals with this product is enabling you to access your data in a quick and intuitive way. If your particular application needs to access a database, we have you covered with 14 different engines, xml file binding, as well as POCO support.

The process of selecting data, therefore, is tailored to your specific needs. As mentioned earlier you can (in order of customizability):

  1. Select tables or views,
  2. Craft a specific query, or
  3. Simply bind to an IEnumerable of your custom generated objects

This level of customization allows for an infinite range of data options suited to your personal needs.

Dashboard Elements

The difficulty of understanding large amounts of data is made much easier with powerful and principled visualizations. Our new dashboard tool has 7 different data visualization elements each with different strengths and options.

Dashboard Elements

PivotThe pivot dashboard element enables a cross-sectional view of data pivoted across multiple dimensions.
GridThe grid enables a standard tabular representation of data. This dashboard element also contains embedded visual cues and displays that assist in quickly understanding data.
ChartThis quintessential visualization tool assists in the creation of bar, point, line, area, range, bubble, and financial charts. Our creation mechanism has also been significantly streamlined in order to visualize your data with simple drop actions.
PieThe pie chart is a powerful visualization tool that enables users to understand distributions over small ranges.
GaugesGauges allow the comparative visualization of two values where one represents a target and the other an actual value. This dashboard element also allows for a multiplicity of gauges in a single dashboard element by creating a series view of the same.
CardCards, similar to gauges, are a textual visualization of target to actual values. These additionally include easy to understand positive/negative visualizations as well as easy to consume data explanations. This is a brand new visualization in the DevExpress family of visualization tools!
Range FilterThe range filter is also a brand new visualization tool that allows for automatic data filtering by presenting a chart based range. The range filter is automatically wired up to be a master filter and enables users to drill down into specific data in an effortless way.

In addition to these data visualization elements, we have also included a static image and text dashboard element allowing finer grained dashboard customization. This will enable the addition of custom images and text that can spruce up the presentation of a dashboard.

Working with a Dashboard Element

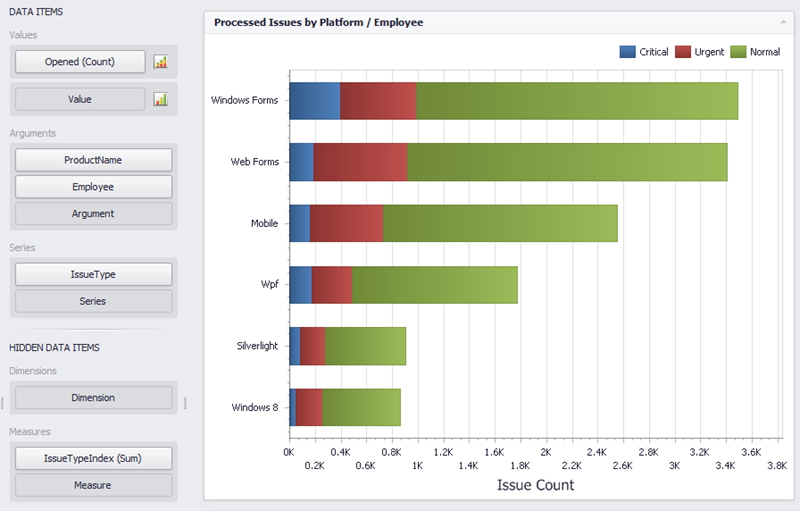
Once a data connection is established, all you need to do to add a dashboard element is click on the corresponding type you wish to create. Once that is done all you need to do from there is start dropping fields into the Data Items section.

Dashboard Element Data Items

Dashboard Element Data

For every dashboard element there are three things to consider:

  1. What data is represented?
  2. How the data is shaped?
  3. How should the user interact with the data?

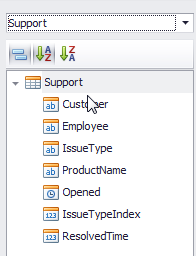
Each dashboard element’s data bindings can be dragged from the available fields from the data source.

Dashboard Fields

The three areas where these can be dragged are the:

  1. Values– the Y axis in the case of a chart (or the values of the items being measured)
  2. Arguments– this can be considered as the X axis (or the items being measured)
  3. Series– different sets of (x, y) pairs

Additionally one can drag fields directly into the Hidden Data Items Section. This section can be used to do additional sorting, filtering, and data shaping on values and arguments that are not necessarily visible in the actual dashboard element. Users of your dashboards will be able to shape data as they see fit – even with data elements not present in the visualization.

Dashboard Element Layout

Each dashboard element also has item specific layout capabilities. A couple of examples:

ChartChart Element Layout Options
GridGrid Element Layout Options
CardsCard Element Layout Options
Etc. 

These layout options are element specific and allow for a tremendous amount of flexibility.

Interactivity

Next I want to tell you about how easy it is to create interactive dashboards. Every dashboard element visualization intrinsically is linked to a specific set of data. Because of this data connection, we are able to provide concise and pain-free methods of creating both dashboard wide filtering as well as simple element drill down. Each dashboard element has a data tab:

Dashboard Element Interactivity Options

The data tab allows you to define either a dashboard wide filter, drill down, as well as the ability to define whether or not a dashboard element even participates in a filter. There is no code, variables, or anything for that matter needed to define these complex yet informative actions.

Viewers

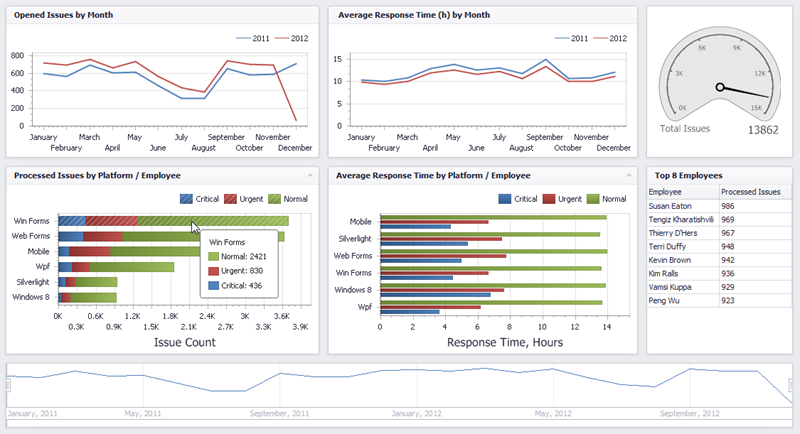
The main output when designing a dashboard is the dashboard definition file. This file is a simple xml file which defines where the data comes from, what dashboard elements are defined, how they are bound, and what interactions have been created. This simple dashboard definition file can then be used in the WinForms dashboard viewer control. The final product looks very similar to the designer:

WinForms Dashboard Viewer

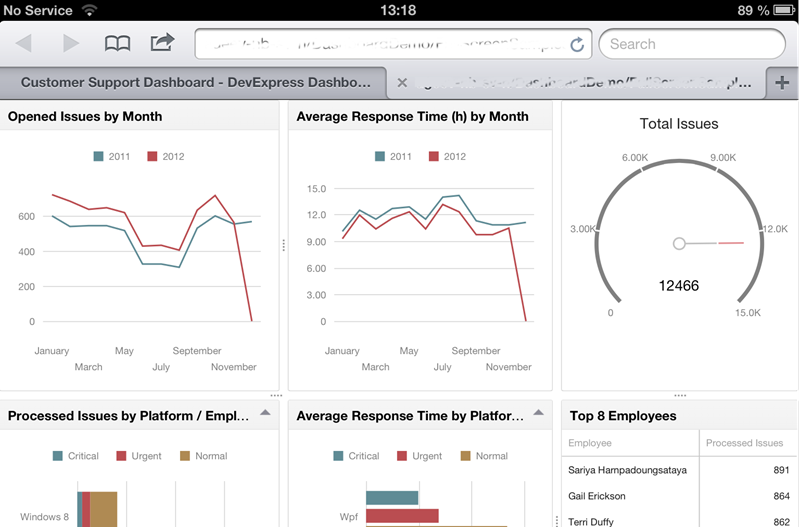
This viewer is fully interactive and will assist your users to get a really good feel for your data. Another exciting viewer we have created is our web viewer:

Web Dashboard Viewer

The web viewer uses our new HTML5/JS visualization tools available in DXTREME making them accessible to virtually any iDevice (above is an example with the iPad), Android, or Windows device. This viewer (just like the WinForms viewer) is simply dragged on to the design surface and bound to the dashboard definition file:

Web Dashboard Viewer at Design Time

It is that simple!

Finally

There is so much more to talk about! I am personally very excited about this new product. As mentioned, my very first official post as a DevExpress employee outlined the importance I’ve always attached to gleaning knowledge from your data. I plan to dive into each aspect a bit more carefully in posts and videos to come.

There is much yet to come! Stay Tuned!

As always, if there are any comments and/or questions, feel free to get a hold of me!

Seth Juarez
Email: sethj@devexpress.com
Twitter: @SethJuarez

DevExpress Snap – Reporting Made Simple

$
0
0

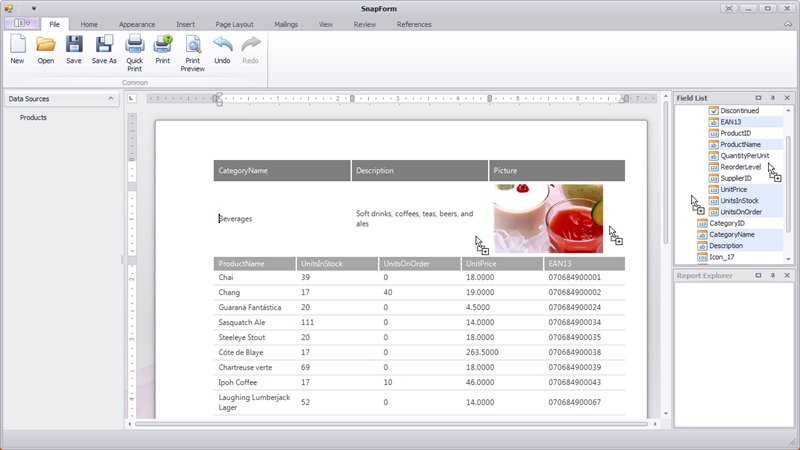
Our recent release here at DevExpress has ushered in a series of new tools that truly make it easier to analyze data. DevExpress Snap is a new style of reporting tool that does just that. A picture is worth a thousand words:

Drag and Drop Reporting

All you have to do is select the appropriate fields and literally drop them on the report surface. Given the fields and shape of the data being dropped, we give you a fairly good estimate of how we think the report should be laid out. Above is our first stab with a hierarchical data set. There are also a number of familiar features which I think make this an interesting way of creating reports.

Data

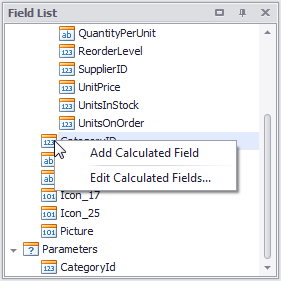
We have drawn upon years of reporting experience with XtraReports and brought over a number of features you have come to expect in our reporting products. Like XtraReports, you can bind to any number of data sources. Additionally DevExpress Snap has the notions of Parameters and Calculated Fields.

DevExpress Snap Field List

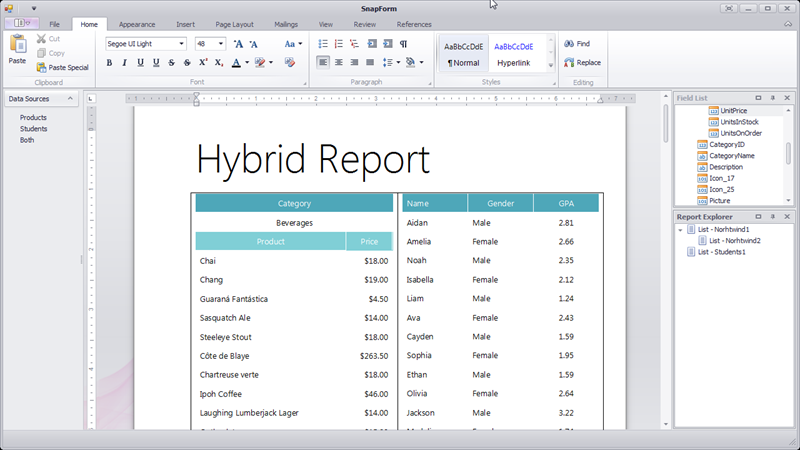
An interesting feature not really available in XtraReports is the concept of binding to multiple data sources. The Snap report document has a DataSources collection where you can bind any number of heterogeneous data sources.

 Hybrid Snap Report

In this example, this report is bound both to the Northwind database and a collection of student objects. In other words, you can bind to completely different kinds of lists and have them live side by side in a report.

Layout and Style

When you need pixel perfect reports, my suggestion is to use our award winning banded report design. If you are interested in more of a flow type layout the best choice is DevExpress Snap. Like Microsoft Word, DevExpress Snap has an extremely friendly and familiar methodology for laying out and styling reports.

Layout Ribbon Menu

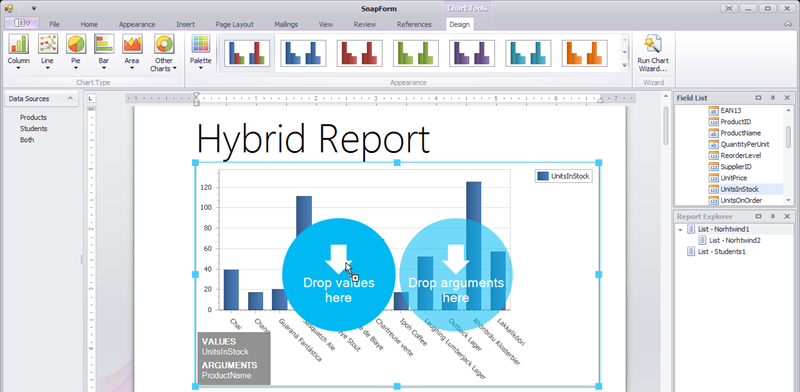
Like Microsoft Word, you can easily add any element to the report from tables to pictures, barcodes to headers, etc. You can even add charts by clicking on the chart button and dragging the appropriate arguments and values right on to the chart.

Fast Charts

Styling is also a simple matter of selecting the things you want to format, and selecting the appropriate format choices in the application ribbon.

Style Ribbon Menu 

Getting Started

In an effort to make sure you are successful we have made a number of videos to help you get started:

  1. Basic Setup
  2. Binding to a Database
  3. Binding to Objects
  4. Binding to Multiple Data Sources

DevExpress Snap is a WinForms control that is included in the WinForms subscription. As with all of our controls this also uses a royalty free distribution model.

This is truly an exciting release!

As always, if there are any comments and/or questions, feel free to get a hold of me!

Seth Juarez
Email: sethj@devexpress.com
Twitter: @SethJuarez

The DevExpress Report Server

$
0
0

I am tremendously excited to introduce an entirely new type of product for DevExpress. This has been a culmination of many requests and questions surrounding:

  1. Customizing the End User Designer,
  2. Managing reports in a database,
  3. Scheduling and distributing reports, and finally
  4. Managing report access

We get many requests for samples and general guidance on how to accomplish these important reporting tasks. The choice was made to simply produce software that covers all of these scenarios. It is engineered from the ground up with your reporting needs in mind. So without further ado, here is the DevExpress Report Server:

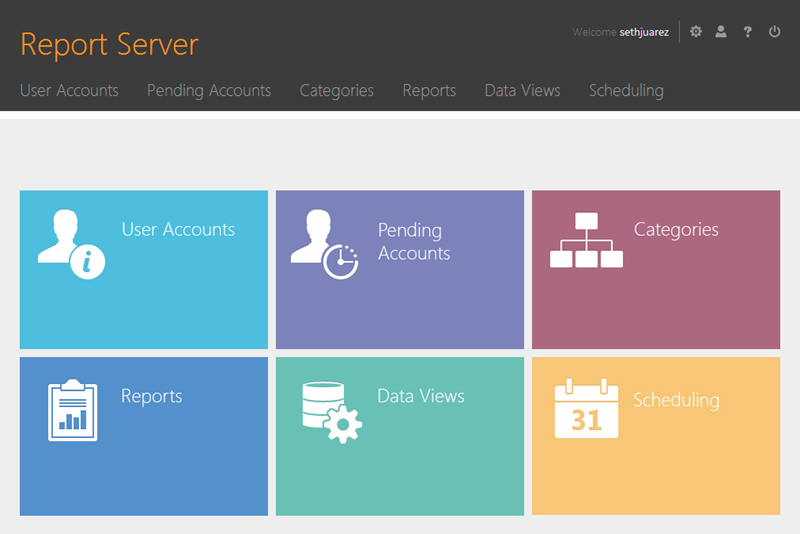
fullserver

Getting Started

In an effort to get everyone up and running as quickly as possible, we have authored a number of videos showing you every important aspect of the DevExpress Report Server:

  1. Preparing Your Server– This video will walk you through getting the prerequisites installed on your server in order to get the report server set up.
  2. Installation– This video walks you through installing both the server as well as the report designer.
  3. Managing Users– In this video, we show how to manage report server users and describe how to get the server email capabilities set up properly along with the different account types as well as the notion of standard and pending accounts. Additionally, we delve into the four different roles available in the report server.
  4. Managing Data Views– Here we present how to expose data shapes that will be consumed by those designing reports.
  5. Managing Reports– This is the bread and butter of where the report server shines. Here we show the process of actually creating and designing reports.
  6. Managing Tasks– This video shows how easy it is to create report distribution tasks and shows how to manage internal as well as external distribution lists.

These resources are designed to describe exactly how to work with the report server as well as exactly what you can do. One of the things that bothers me as a consumer of software products is the lack of transparency when it comes to what software does and and how it is accomplished.

Licensing and Distribution

The DevExpress Report Server and End User Designer ships as part of the Universal Subscription and includes a single Server and 5 simultaneous client access licenses (CALs). I have looked around a bit at comparable reporting servers and can honestly say that this is a bargain. This does not even include all of the other software that comes bundled with our Universal Subscription. My sense is that now is the best time to buy as we are eyeing the possibility of making this a separate product with its own server and access costs. This is a completely self contained product and as such cannot be distributed to your clients as part of any software you create. Simply put, a single Universal Subscription will get you a single server license, a report designer license, and 5 concurrent report viewer licenses.

Server Requirements

There are 5 requirements needed to run the DevExpress Report Server:

  1. SQL Server– the report server uses SQL server to manage reports, users, tasks, etc.
  2. IIS 7.0+, .NET 4.0, ASP.NET MVC 3– The report server administration site is run through IIS and is built on MVC 3 and .NET 4.0
  3. HTTP Activation– HTTP Activation is required in order to have the report designer communicate with the report server
  4. Windows Authentication– this is required at initial install since we add the current windows user as the default administrator. By default the report server uses windows authentication (although this can be changed).
  5. SMTP Mail Server– this is used to send report distributions out to those on your distribution lists as well as for user management emails sent when creating new user accounts.

User Accounts

There are 4 distinct roles that come with the DevExpress Report Server:

  1. System Administrator– this account has permissions to manage users as well as all other permissions given to the other three roles
  2. Data Administrator– this account has permissions to manage the Data Views available to the report creators as well as all other permissions given to the other two roles
  3. Report Creator– the report creator can create, manage, view, and distribute reports
  4. Report Viewer– the report viewer has permissions to view any report

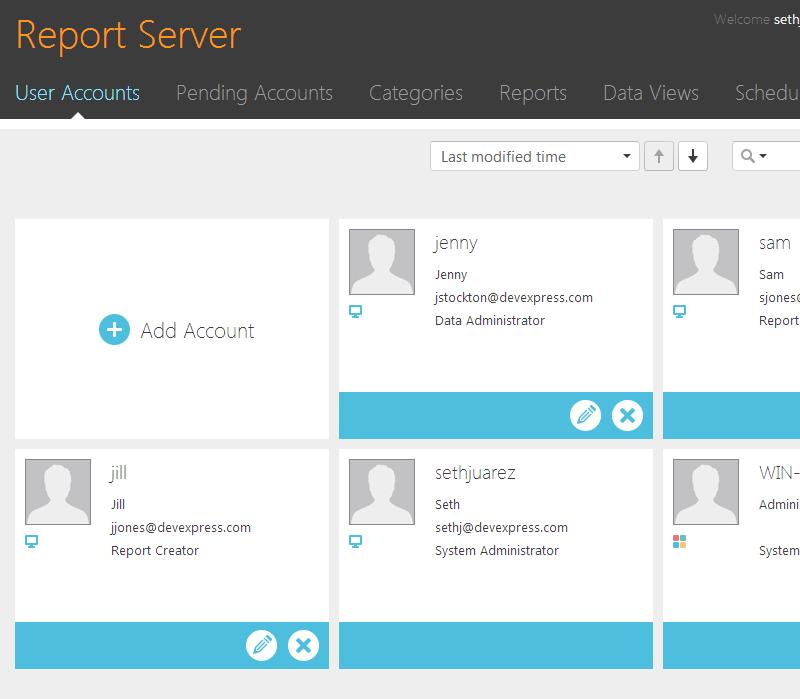
The administrative console for managing users is very straightforward:

useraccounts

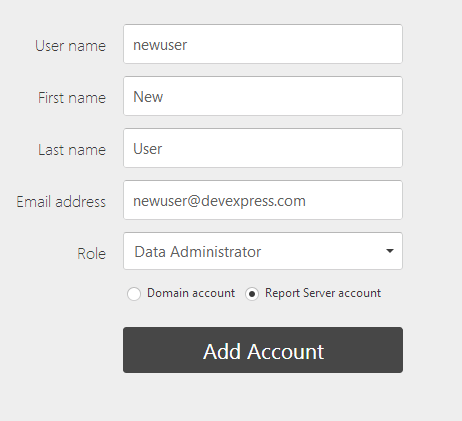
Administrators can add new users by simply clicking on “Add Account” and filling in some information. The server takes care of the rest.

userreg

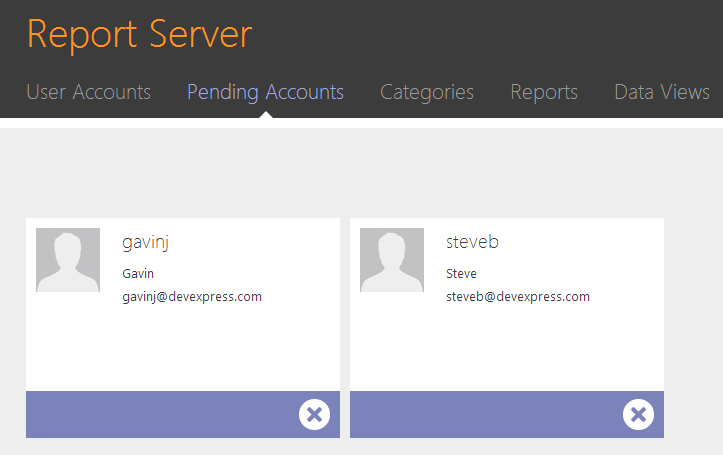
After the administrator clicks “Add Account” the server sends an email to the new user with a custom link requesting they create a new password. The entire process is completely automatic. During the time between the request is sent and the new user creates a new password, the user is placed in a “Pending Account” state where the user is in essence inactive.

pendingaccounts

Getting the Bits

If you would like to try out this brand new product, head on over to our trial page and click on the “Download Universal Trial” button. As soon as you fill in a couple of particulars, you will be met with this:

download

During your trial each report you create will have a modest watermark along with a custom footer explaining that the report was creating with demo software.

Finally

Finally is right! We are tremendously excited to be providing this brand new product in your already rich arsenal of DevExpress tools. We are truly at a point where Reporting is a self-service task and no longer fills the plate of your already time crunched and busy schedule.

In subsequent posts we will be discussing how to provide data shapes to your report creators, managing and creating reports, and scheduling and distributing reports.

As always, if there are any comments and/or questions, feel free to get a hold of me!

Seth Juarez
Email: sethj@devexpress.com
Twitter: @SethJuarez


Working with Data in Dashboards

$
0
0

This write-up is next in a series of posts about dashboards. The introductory post can be found here. One of our overriding concerns when creating a new complex product is making it easy to use. One of the fundamental tasks associated with creating dashboards is accessing data.

Working with a Database

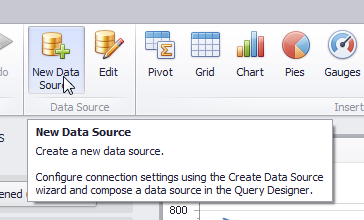
As previously mentioned, we were very concerned with usability. In other words, we wanted you to be able to access data quickly and easily. Clicking on “New Data Source” gets everything started.

New Data Source

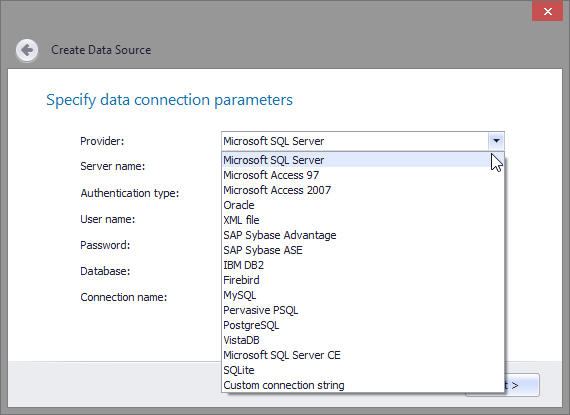
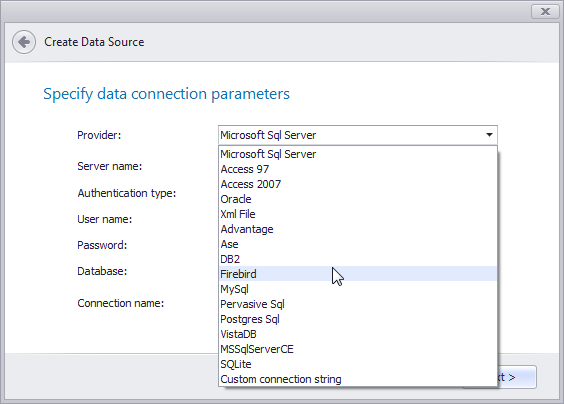
This process starts the Data Source wizard.

Create Data Source

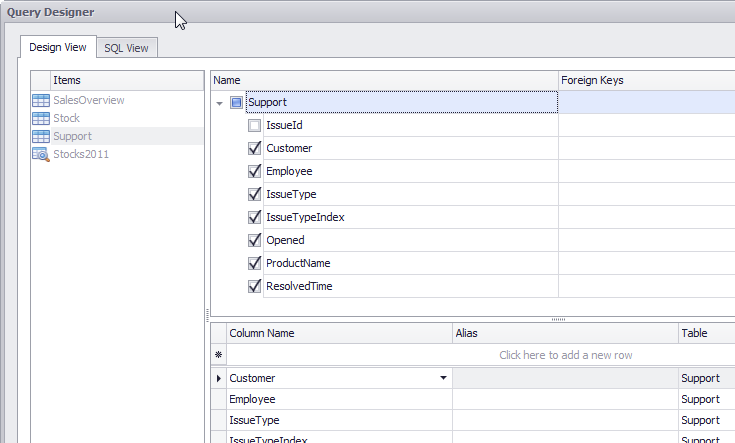
Connecting to a database is simple and intuitive once a connection has been established.

Query Designer

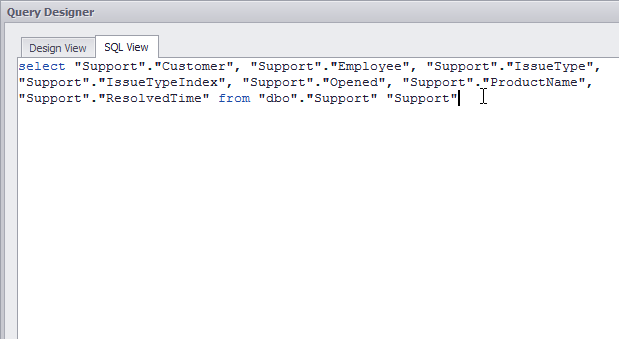
You can pick the series of tables (and respective associations) you would like to make or craft whatever SQL query you wish:

wizard3

This process is made painless by the ability to preview any changes or selections made.

Data Preview

Once you are satisfied with the results, simply click OK. Once the process is complete, you are ready to start adding dashboard elements and binding fields by dragging from the field list over to the data items section.

Dashboard Element Data Items

Working with Objects

Working with objects is really quite simple.

Object Binding Code

In this case, the designer contains the specific dashboard where the data sources are stored. As we will see later, a dashboard can indeed have multiple data sources represented even in the same dashboard. With dashboards, we use a special wrapper class called DataSource which provides all of the ancillary methods needed to manage the disparate data providers available. When binding to objects, we can new up a new DataSource class, give it a name, and pass the object collection as a member of the class. Now all that is left is adding the data source to the dashboard. Literally three lines of code.

Element Data Items

The outcome is exactly the same as if we had bound our dashboard to a database.

Binding to Dashboard Elements

Although I will go into greater detail later for each element, let me lay the ground work for binding here. Every dashboard element has (mostly) the same binding mechanism.

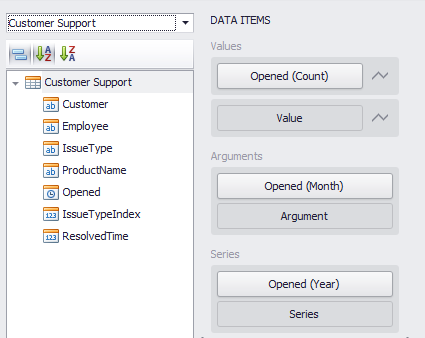
Data Items Area

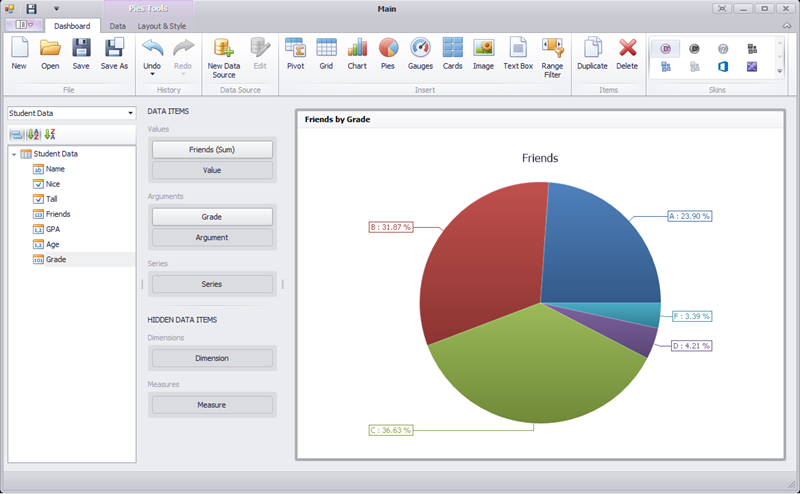
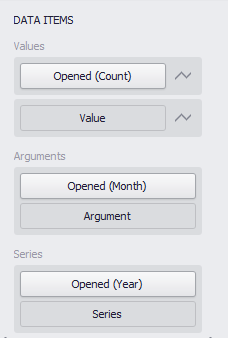
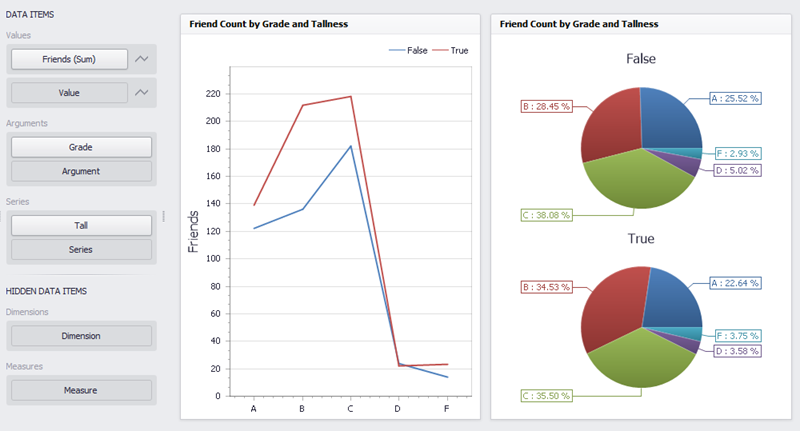
Each dashboard element has Values, Arguments, and Series. The values would correspond to what is typically considered the Y value in an XY graph. The Arguments would be considered the X value. In this example, the Grade is the argument (or X value) being examined while the value indicates the corresponding number of friends for that grade. The Series area allows for the multiplicity of values across another cross section of data. This particular data also has a Boolean value indicating whether or not a student is tall. If we were to drag that over to the series section, it would produce an extra lines (if a line chart) for each value of Tallness. In this case there would be a line for the friend count based on different grades for those that are tall and another for those that are not.

Series Binding

Here you see the line and pie chart with exactly the same bindings. For each dashboard element there are also a number of data shaping tools that will be discussed later

In Summary

We have placed a tremendous amount of emphasis (and will continue to do so) on creating an easy path to complex analysis. We are beginning to pay this promise off with our dashboard product and will continue to refine and perfect this path in all of our complex analysis tools (charts, reports, and dashboards).

In subsequent posts I will spend time on each dashboard element in order to give you a good view of the breadth of functionality available in our dashboards.

As always, if there are any comments and/or questions, feel free to get a hold of me!

Seth Juarez
Email: sethj@devexpress.com
Twitter: @SethJuarez

Managing Data Views in the Report Server

$
0
0

The most important part of any report is the data which it displays. Here I will spend a bit of time explaining how data views within the report server are managed, who manages them, and some best practices when considering these issues. Also we will look at some general network considerations to take into account when setting up data views in order to elucidate the “why” behind certain limitations when working in a truly distributed environment.

Report Server Topology

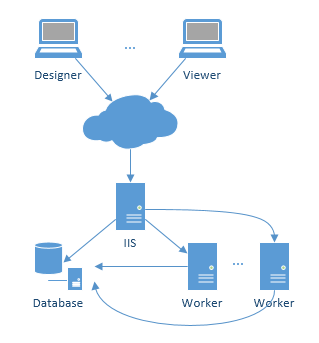
Report Server Network TopologyOne of our primary concerns was enabling high throughput (getting as many reports out as possible). As such the report server actually consists of three separate things: the administrative site (IIS), the scheduling mechanism (IIS), and the worker processes. The administrative site and the scheduling process live on the same server. The administrative site is an IIS site where all of the management of users, data views, reports, and report scheduling occur. In addition to the IIS site there is a TaskScheduler service that checks if there are report tasks that need to run. Unlike the administrative site, the TaskScheduler is actually a Service process. When a particular report task needs to run, the TaskScheduler informs the Worker process (also a Service). The Worker process then takes the time to render the report and send the emails to the interested parties.

The beauty of this setup is that with our report server we have an option where the Worker process can be installed on multiple machines. This can greatly improve the scenario where hundreds of reports need to be generated at the same time every day. The TaskScheduler will route each task to an available Worker thus maximizing the computing resources devoted to generating reports (I will get more into the specifics of setting this type of structure up in later posts).

Given that the administrative site (and report creation) can be exposed across the web (the administrative site is a web site after all), there are certain limitations that need to be understood. Consider the case where the data that is used in reports is behind a firewall. This database, while accessible to the Report Worker process (since it is behind the firewall as well), will not be accessible to the users accessing the system from outside the firewall. This creates a unique challenge that the Report Server solves with the concept of Data Views.

Data Views

Data Views are collections of data shapes available to reports created in the report server. Often I am told that a business has hundreds of reports. Often these boil down into less than 10 actual data shapes. For example, a consulting firm with hundreds of reports may have only two reportable shapes: Client Reports and Project Reports. In other words they have two basic reportable data shapes. One of my most oft given suggestions when engineering a reporting system is to boil down all reports into their basic shapes. My strategy for doing so involves finding the most important database entities (clients and projects) an hoisting these entities as the root of a data shape. While this is inexact science, creating these basic data shapes allows for easy field addition (on the root or sub entities) without having to modify existing reports bound to the same shape.

Creating Data Views

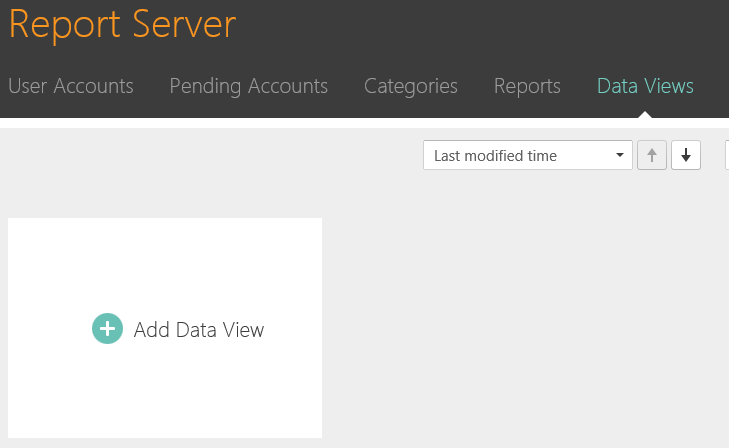
Data View Screen

The first step is to navigate to the data views section and select “Add Data View.” Clicking on this option yields the following screen:

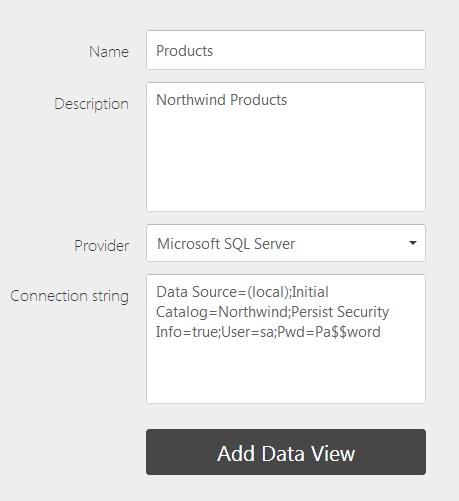
Data View Form

In this example I used the Microsoft SQL Server Provider. The reality is you can use any provide which XPO supports. The key is to remember the general report server layout when creating the connection string. This connection string has a Data Source equal to (local). In the context of the network diagram above (local) refers to the actual IIS server. If any of the worker processes lived on a separate machine, this would cause a problem. Consider also the case where Integrated Security is used to access SQL Server rather than an explicit username and password. In this case which user is accessing SQL Server? If the default installation path was chosen this would be none other than the NETWORK SERVICE user:

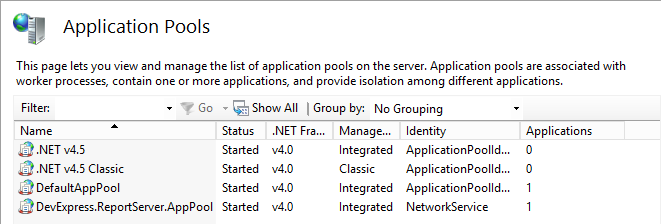
App Pool Identity

Notice that the custom AppPool created in IIS contains the NetworkService Identity. This is also the case for the TaskScheduler and Worker services:

Services Identity

It is essential to understand these key principles when creating Data Views.

Once the Data View form is filled out and the users presses “Add Data View” the user then can create the data shape to be exposed to the report designers:

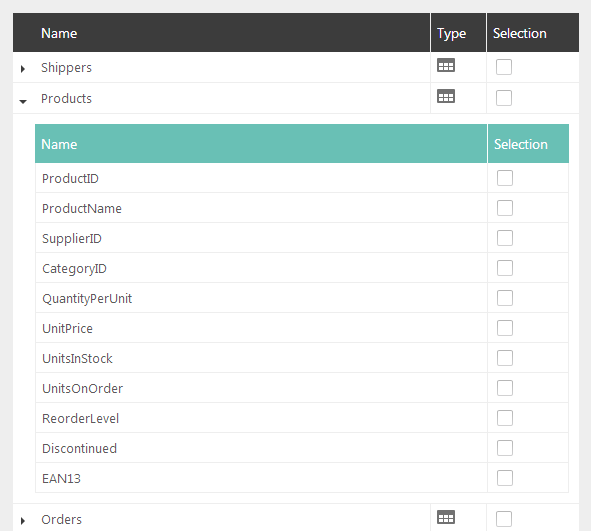
Creating Data Shapes

One can even control the exact fields within tables that are exposed:

Creating Data Shapes (Fields)

In this case I selected the Products and Categories table. Once the user clicks “Fill Data View” they are taken back to the Data Views page:

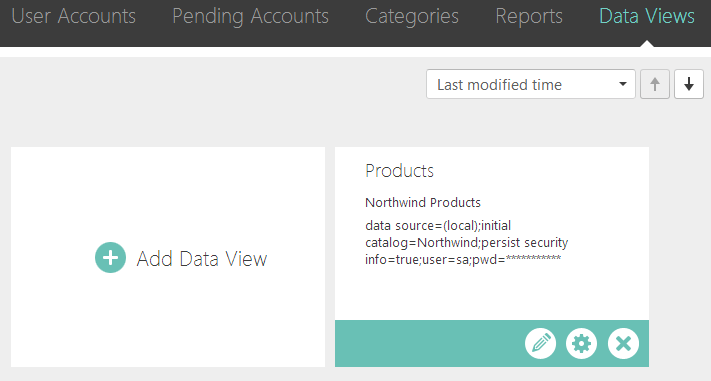
Added Data View

Managing Data Views

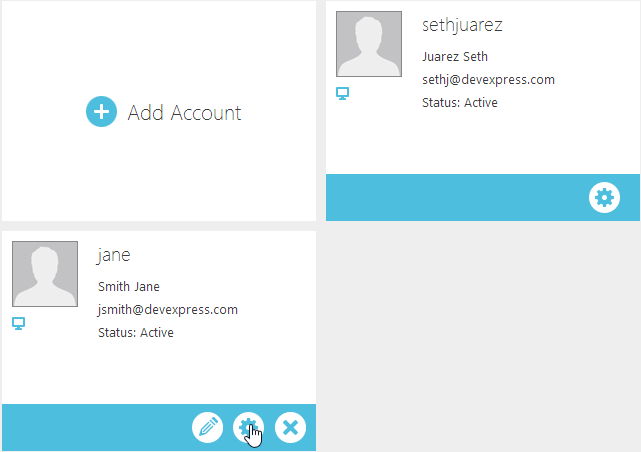
The task of managing data views falls specifically to data administrators (although System Administrators also have that right). Once a Data View has been created there are two changes that can be made: edit the connection information and edit the shape. Clicking on the pencil icon will take the user to the Data View Form while clicking on the gear will allow the user to change the data shape.

Consuming Data Views

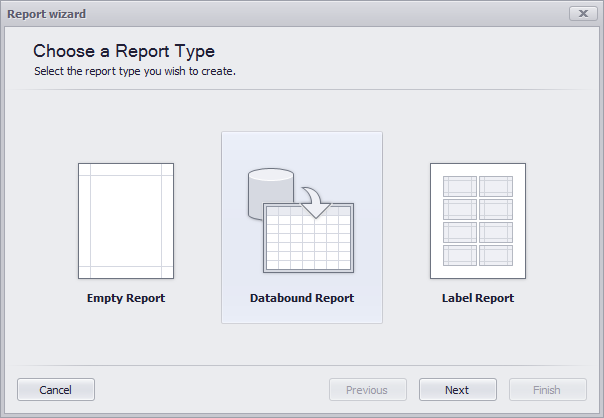
With the data view created, one need only fire up the End User Report Designer to consume the new data shape. There are two options to do this. If you are trying to create a flat table report (i.e. no sub reports) you can select “Databound Report” after adding a new server report:

Report Wizard

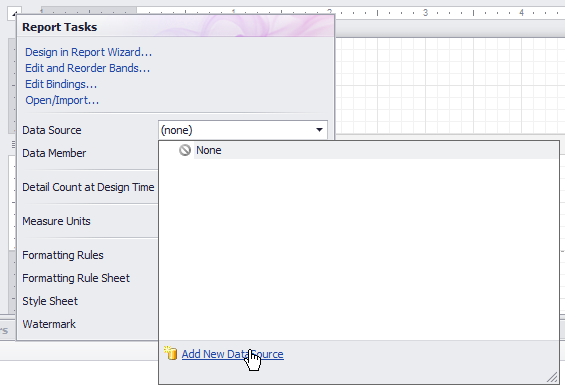
This will lead the user through a standard reporting wizard designed primarily to create flat data bound reports (i.e. no hierarchy in the data shape). This is an absolutely great wizard for the majority of simple reports. If you need to create a more complex report based on a master-detail hierarchy in the data shape, simply select “Empty Report” and fill the data source manually:

Add Data Source 

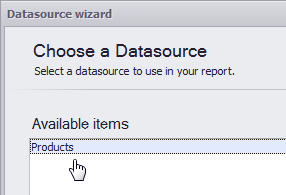
Clicking “Add New DataSource” invokes a new Wizard which lets you select the Data View

Select Data View 

as well as the participating entities:

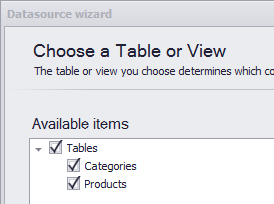
Select Tables or Views

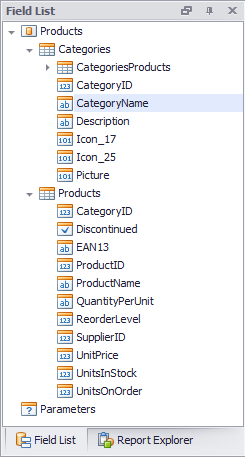
Once the users selects finish they will have access to all of the fields participating in the created data view:

Report Field List

Conclusion

That is it! I hope this little tour through Data Views inside of the Report Server has been helpful. The part that trips most people up is awareness of the actual topology of the network wherein the Report Server resides. Once this is clear, everything else flows much easier.

As always, if there are any comments and/or questions, feel free to get a hold of me!

Seth Juarez
Email: sethj@devexpress.com
Twitter: @SethJuarez

WinForms Spreadsheet Control (coming in 13.1)

$
0
0

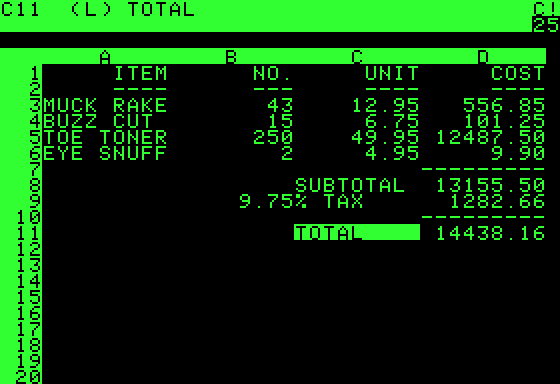
Whether we like it or not, the spreadsheet has become a de facto analysis tool for small datasets. Its debut in June of 1979 as a software package called VisiCalc predated my own birth by an entire month!

VisiCalc 
Source: http://commons.wikimedia.org/wiki/File:Visicalc.png

Since then there have been a number of revisions and consolidations culminating in the widely known software package we all know and love: Microsoft Excel. At DevExpress we recognize the importance spreadsheets and wanted to empower our users to take advantage of the rich facilities this tool provides without the hassle of having to learn a complex API or interact with foreign runtimes. To give you an idea of how easy it is to work with our client agnostic API I wrote a simple console application that generates an entire Excel spreadsheet in about 5 minutes:

// 1. Creating document
DocumentModel doc = new DocumentModel();
doc.Sheets.Add(new Worksheet(doc, "mysheet"));
var sheet = doc.ActiveSheet;

// 2. Adding Data
Random r = new Random(DateTime.Now.Millisecond);
for (int i = 0; i < 15; i++)
    for (int j = 0; j < 20; j++)
    {
        sheet[i, j].Value = r.NextDouble() * 100;
        if ((i + j) % 2 == 0)
            sheet[i, j].Font.Color = Color.Red;
        else
            sheet[i, j].Font.Color = Color.Blue;
    }

// 3. Saving Spreadsheet
using (var stream = File.OpenWrite("myfile.xls"))
    doc.SaveDocument(stream, DevExpress.Spreadsheet.DocumentFormat.Xls, "");

As is to be expected, the largest portion of the application deals with generating data. Notice how easy it is to access, edit, and style each individual cell. During our initial usability tests I mentioned to the development team that there were a number of things we should be able to do easily and without much ceremony. I then sat down and tried to implement a couple of things I thought should be easy. Within a matter of minutes I had completed each task without assistance or intervention from the development team.

One of the tasks that proved to be the easiest was using the SpreadsheetControl inside of a WinForms application. In a couple of clicks you can create a fully functioning spreadsheet application complete with formatting, layout, forumlas, etc.:

DevExpress Spreadsheet Control

I am extremely proud of the work that has been done in order to get these great tools to you, our valued customer.

As always, if there are any comments and/or questions, feel free to get a hold of me!

Seth Juarez
Email: sethj@devexpress.com
Twitter: @SethJuarez

WinForms Map Control (coming in 13.1)

$
0
0

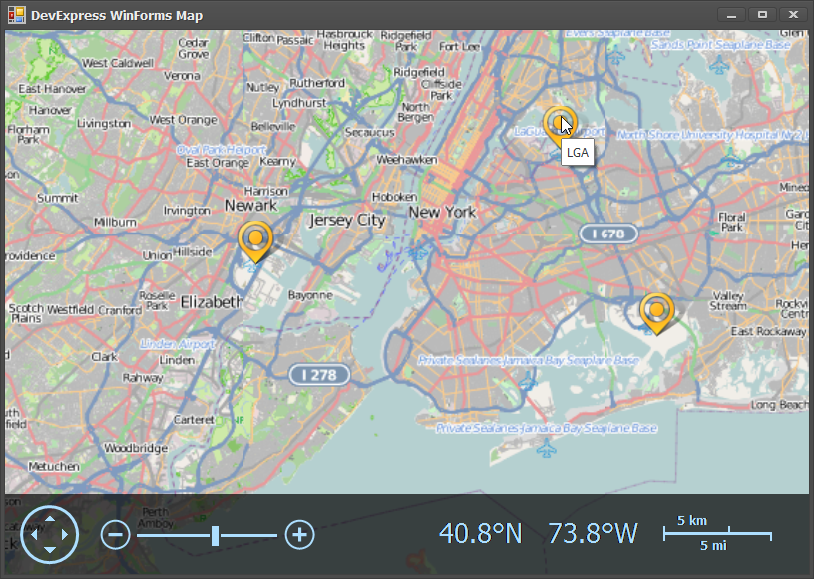
As we near release I thought I would show you another WinForms gem we are adding in 13.1: the WinForms Map Control. When it comes to data analysis the key to understanding is the concise display of many dimensions. A map allows you to convey locality in a truly unparalleled way. This sample represents the top 25 US airports (zoomed into the New York/New Jersey area):

WinForms Map Control

Adding a Map to your WinForms project is a simple drag and drop operation. Once the control is on your Form, you can add an Image Layer from either Bing or OpenStreet (the example above is OpenStreet). You can additionally add any number of vector layers from either a file (KML, SHP supported), from a database, or directly in code.

WinForms Map Control Layers

For this example I used our soon-to-be-released Spreadsheet API to load a csv file of airport locations directly into the map:

var layer = (VectorItemsLayer)mapControl1.Layers[1];

DocumentModel doc = new DocumentModel();
using (var stream = File.OpenRead("airports.csv"))
    doc.LoadDocument(stream, DocumentFormat.Csv, "");

var sheet = doc.ActiveSheet;
for (int i = 1; i < sheet.Rows.Count; i++)
{
    string code = sheet[0, i].Text;
    double lat = sheet[1, i].Value.NumericValue;
    double lng = sheet[2, i].Value.NumericValue;

    MapPushpin pushpin = new MapPushpin { Location = new GeoPoint(lat, lng), ToolTipPattern = code };
    layer.Items.Add(pushpin);
}

mapControl1.ZoomLevel = 4.5;
mapControl1.CenterPoint = new GeoPoint(37.50, -98.35);

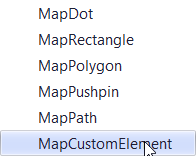
The code simply loads the csv file and creates pusphins for each airport represented in the data. Since these are only US airports, I zoom in and center the map using the ZoomLevel and CenterPoint properties in the map. Aside from the pushpin, there are a number of other map elements that can be added including Dots, Rectangles, Polygons, Paths, and even a Custom Element:

WinForms Map Control Map Elements

We are tremendously excited for the great crop of things coming during our 13.1 series of releases.

As always, if there are any comments and/or questions, feel free to get a hold of me!

Seth Juarez
Email: sethj@devexpress.com
Twitter: @SethJuarez

Report Sparklines (coming in 13.1)

$
0
0

With the debut of our WinForms Sparkline control we’ve decided to also add it to our reporting toolbox.

Reports Sparkline Design

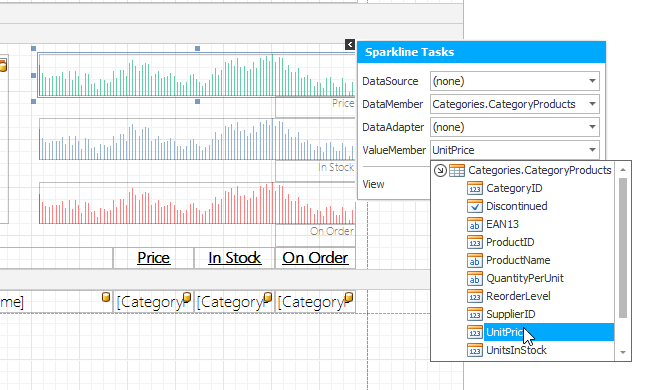
Using Sparklines in reports is fairly straightforward. In this case I created the simple Category/Products report from the Northwind Database and added several Sparkline controls to the group header band of the Product detail section. From there it was a simple case of selecting the appropriate data member (which is already available from the report bindings) and value member. From there one can select the appropriate view and customize the colors as well as specific view properties.

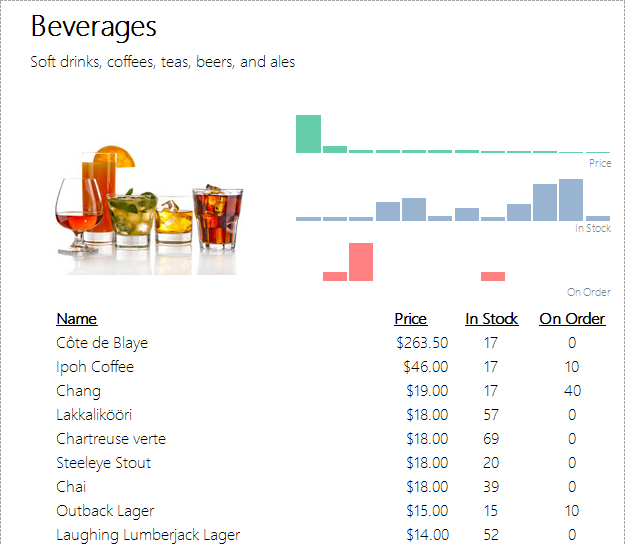
Reports Sparkline Preview

The end result is both elegant and informative! At a glance we cam compare product price, stock, and orders at a glance. For Beverages it becomes readily apparent that we have a stocking problem with one product and a pricing problem with another.

I am excited for the kinds of reports this type of control will enable and am looking forward to what you create!

As always, if there are any comments and/or questions, feel free to get a hold of me!

Seth Juarez
Email: sethj@devexpress.com
Twitter: @SethJuarez

Report Improvements (coming in 13.1)

$
0
0

We have decided to make usability a point of emphasis when it comes to our great set of tools designed to deal with complex data. As such we have introduced a number of enhancements which should improve the way you interact with our reporting suite.

Consolidation

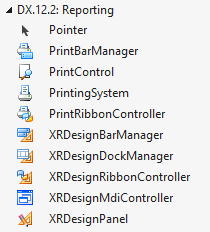
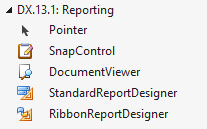
When dealing with WinForms reporting there were a number of components one could choose from in order to either view or design reports.

Old Reporting Toolbox

We realized that the use case was pretty simple: you want to either add the ability to view a report or edit one. As such we have greatly simplified the way in which this is done by consolidating some of the tools available in the toolbox.

New Reporting Toolbox

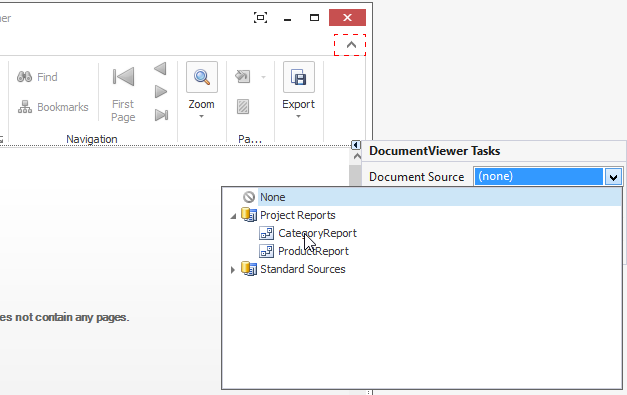
When dropping a Document Viewer you can then choose to create a standard or ribbon toolbar as well as choose the initial report you would like to load:

New Report Viewer Component

Dropping the End User Designer item from the toolbox creates everything you need to get started with editing and designing reports.

Building Reports

By the time you are ready to build reports we understand you want to get them out the door as quickly and as easily as possible. Here are a couple of features that will help:

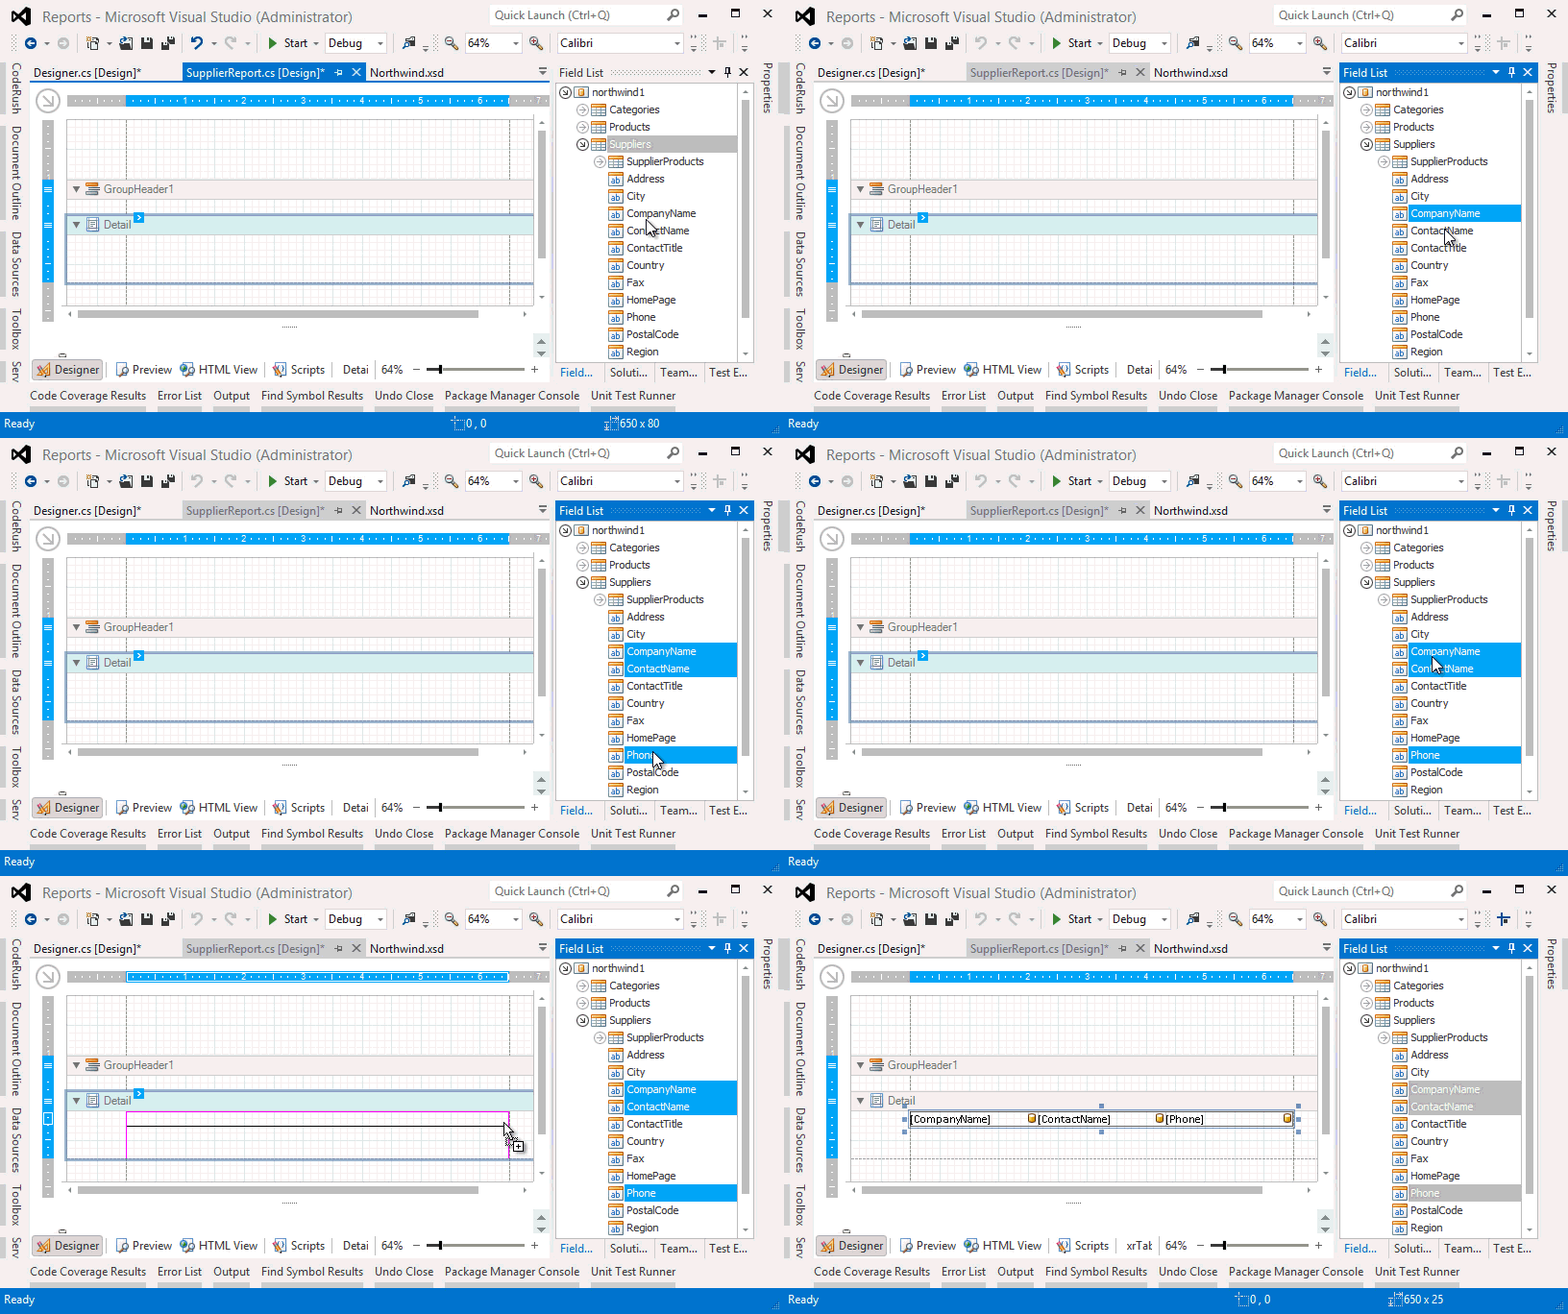
Cntrl + Select fields then drag to table

Dragging Fields

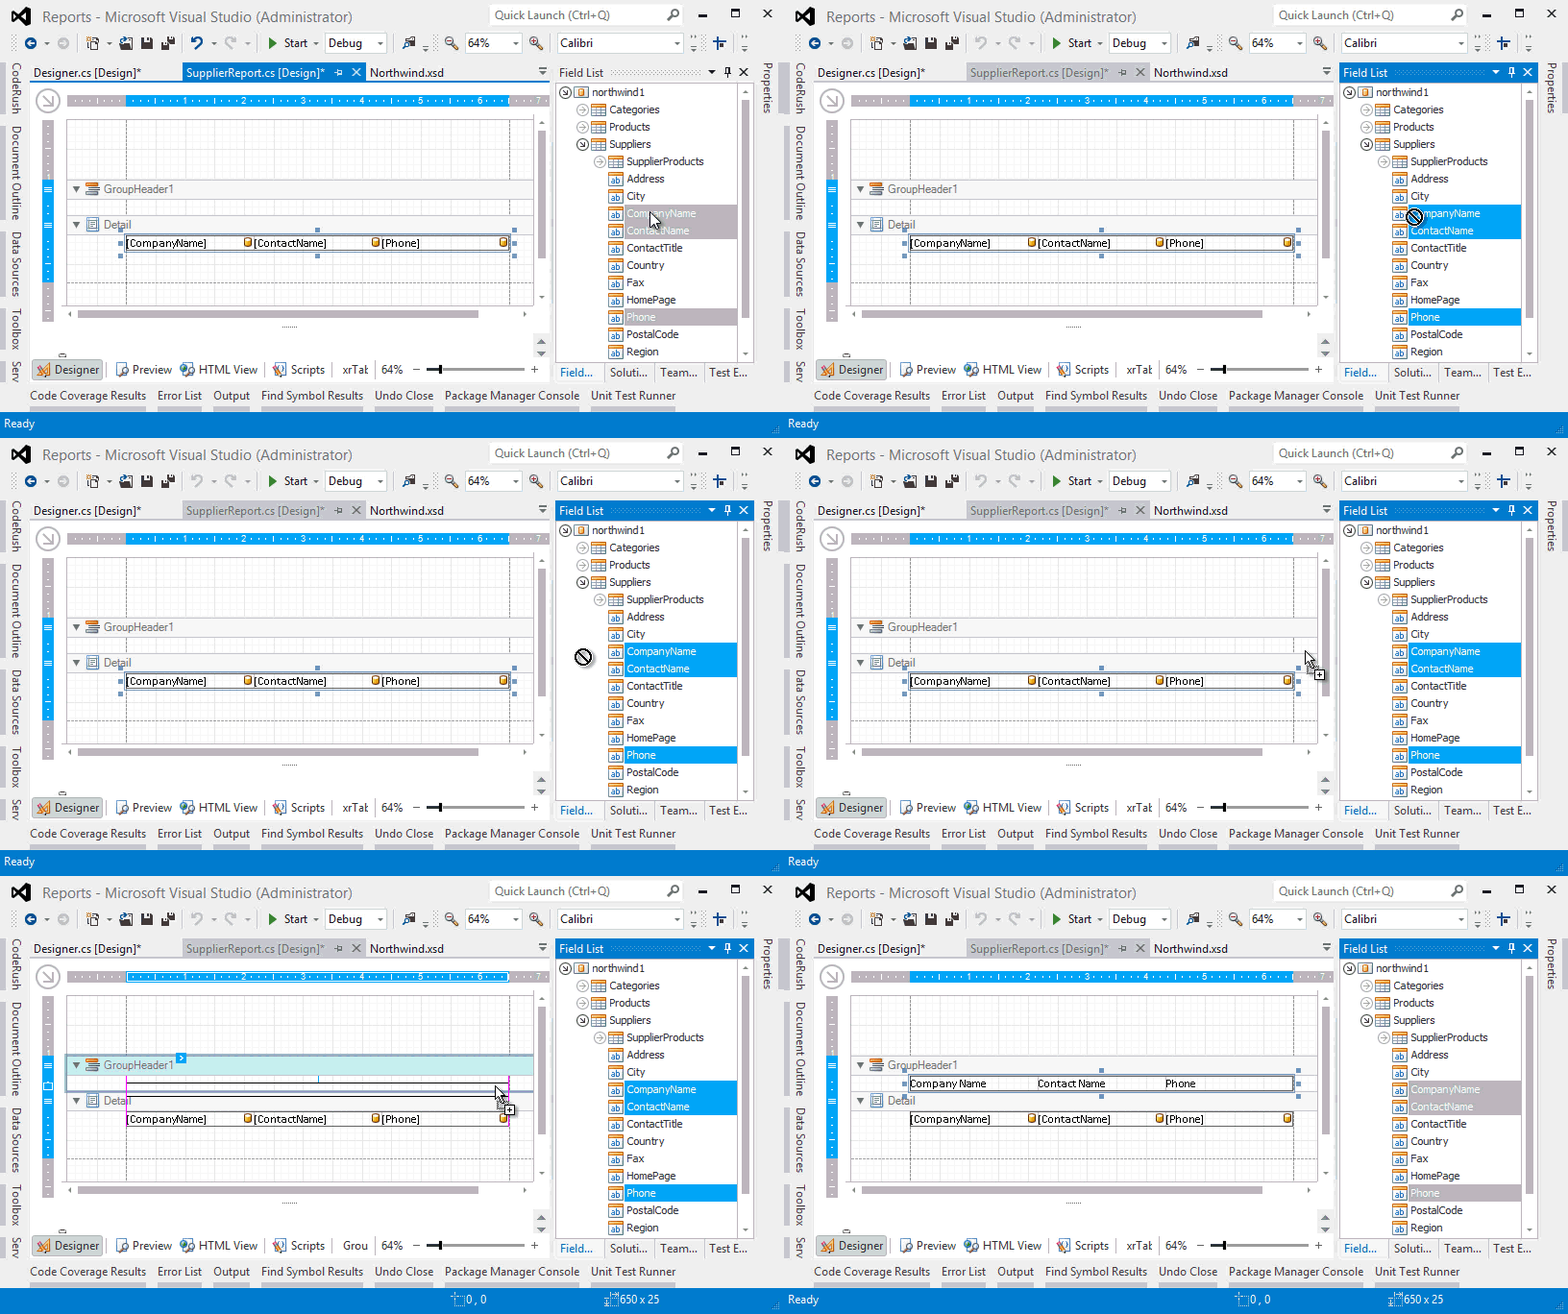
Cntrl + Select fields then drag (right mouse button) to drag labels to a table

Dragging Headers

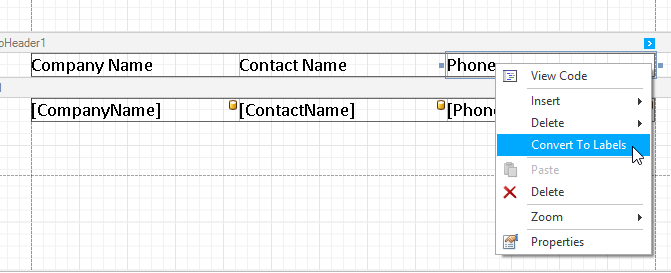
Convert Table to Labels

Converting to Labels

We pledge to continue this trend of enabling you to procrastinate (effectively) the task of writing reports.

As always, if there are any comments and/or questions, feel free to get a hold of me!

Seth Juarez
Email: sethj@devexpress.com
Twitter: @SethJuarez

Dashboard Printing and Exporting (coming in 13.1)

$
0
0

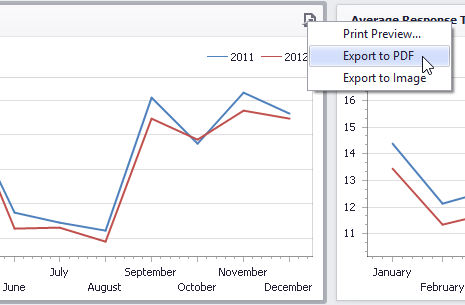
One key feature many requested for our powerful dashboard tool was printing and exporting. Beginning with 13.1 you will be able to print both individual elements as well as the entire dashboard with little to no code.

Printing/Exporting Individual Elements

Dashboard Item Print (WinForms)

This feature is available in both the Windows and Web versions.

Dashboard Item Print (WebForms)

Full Print Preview

Printing an entire dashboard is also straight forward in WinForms:

dashboardViewer.PrintingOptions.PageLayout = DashboardPrintingPageLayout.Landscape;
dashboardViewer.PrintingOptions.ScaleMode = DashboardPrintingScaleMode.AutoFitToPageWidth;
dashboardViewer.ShowRibbonPrintPreview();

Notice that you have access to printing options as well as the option to use a Bar Preview or a Ribbon Preview form (in this example I use the latter).

WinForms Print Preview

This print preview uses our award winning XtraReports preview form which enables a large array of features including exporting, sizing, etc..

As always, if there are any comments and/or questions, feel free to get a hold of me!

Seth Juarez
Email: sethj@devexpress.com
Twitter: @SethJuarez


Table of Contents Report Control (coming in 13.1)

$
0
0

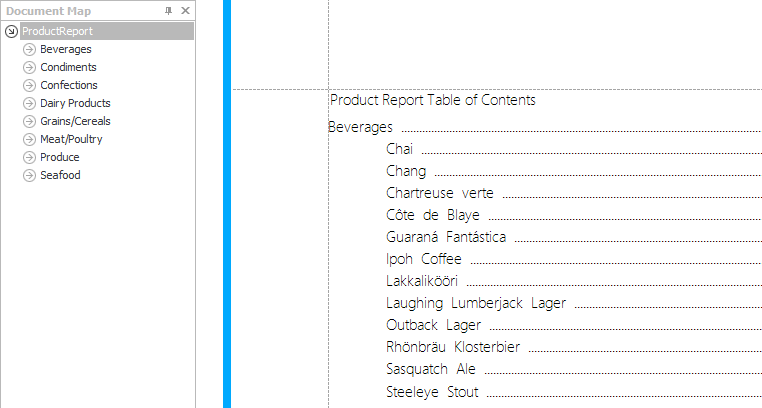
The DevExpress reporting suite has a tremendous bookmarking and document map feature which makes it extremely easy to quickly understand and navigate the data inside of a report. We have decided to take that same functionality to the next level by introducing a new table of contents control which leverages the the already powerful bookmarking set of features. Simply put, if your report already uses bookmarks then all you need to do is drop the new XRTableOfContents control on to your report, change the LevelTitle, and you have a ready made table of contents available to the consumers of your report:

Table of Contents Control

This control also leverages all of the existing styling as well as fine grained control over the granularity (or levels) available in the table of contents.

Table of Contents Control in a Report

This is an exciting addition to an already feature rich staple of controls available in the DevExpress Reporting toolset.

As always, if there are any comments and/or questions, feel free to get a hold of me!

Seth Juarez
Email: sethj@devexpress.com
Twitter: @SethJuarez

Enterprise Ready Reporting with the DevExpress Report Server

$
0
0

Ever since our beta release of the DevExpress Report Server we have been busy adding important enterprise features to the product. One of those essential features is enterprise ready security. Starting with this release the DevExpress Report Server includes 4 unique built-in security groups associated with the report process:

  • System Administrator: Full access to all server functionality and user account administration.
  • Data Administrator: Ability to manage and control the data available to reports.
  • Report Creator: Maintain report categories and create/manage individual reports.
  • Report Viewer: Access to view and print reports and to receive report distributions.

While these were available in our previous release, the level of customizability we have added was not. These built-in groups are completely customizable. You can delete them (with the exception of the System Administrator group), rename them, and even modify the access and scope available to members of the group. In addition to these customizable roles you can create an infinite number of groups with 4 different access modes (Read, Read/Modify, Read/Modify/Delete, and Create) in 9 separate scopes (All Categories, Specific Category, All Reports, Reports in Category, Specific Report, All Data Views, Specific Data View, All Scheduled Jobs, and Specific Scheduled Job).

Groups

Adding, removing, and editing groups can now be done via a special Group Tab.

Report Server Groups

Clicking on the pencil icon leads to a screen where group membership can be established:

Report Server Group Membership

Clicking on the gears icon brings up the permission set window:

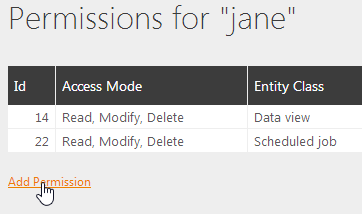
Report Server Group Permissions

Notice that when adding permissions you can select both an Access Mode,

Report Server Access Modes

and restrict the Access Mode to a particular Scope:

Report Server Access Scopes

In all, these collection of features allow for an infinite number of combinations in order to tailor to your specific security needs.

Individual

Adding an individual to a group automatically adds all of the corresponding permissions to the users. In addition to this automatic application of rights, you can also add additional permissions to the individual user by clicking on the gear icon of the user:

Report Server User Screen

This leads to the familiar permissions area but for only the particular user in question:

Report Server User Permissions

Notice that in addition to the inherited permissions one can add additional ones by clicking “Add Permission".”

FAQ’s and Pricing

We are excited to finally release the DevExpress Report Server as a standalone product. We have a truly affordable price and clear licensing for the product.

Try It!

We would love for you to give it a spin! We have created an Azure based demo where you can try the server yourself: http://dxrs-demo.cloudapp.net/. There are a couple of things you need to do to try it:

  1. Create an account by clicking “New User”
  2. Install the Client Side Report Designer (you will receive an email with a download link)
  3. Activate your account.

We really want this to be a product that you come to rely upon to deliver on your reporting needs. I want to personally know how you use the product, where it succeeds, and how we can make it better.

As always, if there are any comments and/or questions, feel free to get a hold of me!

Seth Juarez
Email: sethj@devexpress.com
Twitter: @SethJuarez

Building Data Rich Reports in a Snap (with Snap for WinForms)

$
0
0

Building top notch reports is hard; but not because building reports is a difficult task. The fact of the matter is that report building is often fraught with a set of miniscule tasks spread over a large amount of time. “Can you change the font….?” “I’m not sure that is the appropriate shade of red.” “How hard can it be to make a new report?”

With Snap for WinForms we can finally say “Sure! You do it.” We’ve recently even added two features that should make the process of offloading this task to your end users:

  1. Nested Fields
  2. Data Source Wizard

Nested Fields

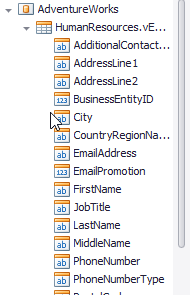
One of the best UX design principles when it comes to managing data is the notion that we should only expose exactly what is necessary for the task at hand and allow the end user to drill in to more complex functionality as needed. This is especially true of the Field List. Often users are presented with something like this:

Long Field List

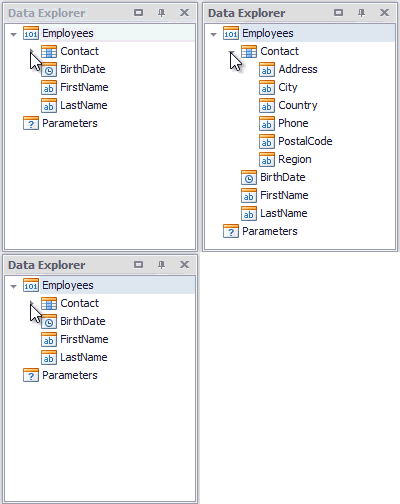
While not necessarily too cumbersome it is often useful to compartmentalize the data: in other words, create a hierarchy of fields such as this:

Nested Fields

It is important to note two things:

  1. The data is still flat (i.e. it isn’t a one-to-many relationship)
  2. This was accomplished by using a set of objects as the datasource

The first thing I did was create two classes:

public class Person
{
    public string FirstName { get; set; }
    public string LastName { get; set; }
    public DateTime BirthDate { get; set; }
    public Contact Contact { get; set; }
}

public class Contact
{
    public string Address { get; set; }
    public string City { get; set; }
    public string Region { get; set; }
    public string PostalCode { get; set; }
    public string Country { get; set; }
    public string Phone { get; set; }
}

Note that there is a Nested Field (Contact) which contains additional information.

snapControl1.Document.DataSources.Add("Employees", Retrieve.Persons());

Finally I add an array of Persons (Person[]) as a DataSource. Done!

Data Source Wizard

One of the best features of our dashboard designer was the introduction of the powerful data source wizard. We’ve taken this powerful wizard and added it into Snap reporting:

Data Source Wizard

This will activate the same DataSource wizard available in our dashboard software:

Data Source Wizard Options

Running through the wizard will the provide the appropriate fields and allow your users to get up and running quickly with little to no developer intervention.

Snap Report

Summary

I would love your thoughts! We are making a strong push in our data analysis and presentation groups to simplify the interaction surface of our products in an effort to make it easier to produce more compelling data visualizations and reports. How are we doing?

As always, if there are any comments and/or questions, feel free to get a hold of me!

Seth Juarez
Email: sethj@devexpress.com
Twitter: @SethJuarez

DevExpress Live Classroom Traning on Reporting

$
0
0

One of my favorite things to do is to get up in front of a crowd and teach. I have been teaching off and on for the majority of my adult life. During that time I have taught at two high schools, a technical school, and at a full-fledged University. The best part of teaching a class is the interaction that enriches not only the students, but especially the teacher. I have learned a great deal from the many people with which I have had the chance to interact.

When I was presented with the opportunity to teach in a classroom setting I jumped at the chance. I am tremendously excited to announce that I will be teaching a full three day course on our powerful reporting suite. I have used this product off and on since 2006. I have also had the opportunity to provide input and direction on the product for the last three years. In short, I am confident that we will be able to discuss your particular reporting scenarios in a way that will make you more productive and successful with reports. Additionally, given that I am also a program manager over the product, your feedback and commentary will not be a mere wish list of things the product could be; I will take these suggestions seriously by taking them directly to the development team.

What will the class cover?

The way I understand reporting is through a three pronged approach:

  1. Data– understanding how to acquire and shape data in anticipation of creating reports
  2. Layout– understanding how to use the report designer in order to create stylish and informative reports
  3. Presentation– understanding how to visualize reports in your particular environment

Here is a smattering of topics we will cover in order to pay off the three main points outlined above:

Report Banding
Database Binding
Object Binding
Grouping, Sorting
Filtering, Summarization
Parameters, Calculated Fields
XRBarCode
XRCheckBox
XRCrossBandBox
XRCrossBandLine
XRLabel
XRLine
XRPageBreak
XRPageInfo
XRPanel
XRPictureBox
XRShape
XRTable
XRChart
XRSparkline
XRPivotGrid
XRPivotGrid
XRRichText
XRSubreport
Styling by Inheritance
Styling by Declaration
Styling by Name
Bookmarks
Document Map
Table of Contents
Events
Scripting
Visualizing with WinForms
Visualizing with ASP.NET WebForms
Visualizing with ASP.NET MVC
Visualizing with WPF
Visualizing with Silverligh
WinForms End User Report Designer
WPF End User Report Designer
Silverlight End User Report Designer

Location/Time

This class will be delivered directly in the DevExpress headquarters on October 7-9 2013. One of the benefits of doing it this way is the unprecedented access this gives you to ask any of our personnel any question you might have!

A Caution

Unfortunately seating is limited. Based on the demand I am happy to do this class as often as you require. IN addition to that I am currently developing ideas for additional classes in the space f Data Shaping, Analysis, and Presentation. Should you have any additional suggestions for classes, please do not hesitate to contact ur training Director Oliver Sturm. It is under his watchful eye that these courses are being prepared and administered.

As always, if there are any comments and/or questions, feel free to get a hold of me!

Seth Juarez
Email: sethj@devexpress.com
Twitter: @SethJuarez

Conference Report–DevLink 2013

$
0
0

Some of my favorite events are located in the south (and mid-west). One of those happens to be DevLink. When presented with the opportunity to attend I was ecstatic to immediately accept. At DevExpress we are committed in our support of developer communities and strive to add value to those that attend these great conferences. I was honored with the invitation to be part of the closing panel on being a polyglot programmer. While I tend to be fairly pragmatic when it comes to software development, there are a couple of things I truly believe (in tweet form):

Creating a silo for yourself as a developer will eventually stunt your professional growth. It is also important to note that I am not saying which languages to learn!

The neat thing about all programming languages is their own unique point of view. Understanding their respective points of view can strengthen and fill our knowledge and make us better as professional developers. Finally, there is always friction in learning something new. I had a tremendously difficult time with functional languages. For me it took a class in college for some of the concepts to sink in.

Lastly, I am fairly skeptical of the counsel of those that are dogmatic in their opinions:

The wonderful thing about our particular field is that there are many ways to do the same thing. When someone intimates that there is only one right way to do it - be skeptical.

It was definitely a great experience! I look forward to getting out more to get your distinct points of view regarding our products as well as technology in general.

If you are interested in seeing the full discussion, someone was kind enough to record the whole thing:

As always, if there are any comments and/or questions, feel free to get a hold of me!

Seth Juarez
Email: sethj@devexpress.com
Twitter: @SethJuarez

Viewing all 61 articles
Browse latest View live


Latest Images