Quantcast
Channel: DevExpress Data Blog
Viewing all 61 articles
Browse latest View live

A Gentle Introduction to XAF–Webinar on September 17, 2013. 10:00 AM Pacific

$
0
0

So I finally decided to take the plunge. I was recently (couple of months ago) in our main development office with a firm resolve to finally learn XAF. With Dennis at my side (I know that’s cheating) we dove into creating a made up application. What I found was strikingly pleasant and powerful! Although I would not consider myself an XAF guru, I do have some tips to help everyone get started. As such, I decided to email Amanda to set up a webinar:

Date: September 17, 2013 10:00 AM (Pacific Time)
Title: A Gentle Introduction to XAF
Description: In this webinar, Seth Juarez will discuss the general philosophy behind XAF while he builds an application from scratch. Hear about the notion of modules and see how built-in security features work, plus watch Seth extend basic functionality as he develops a new Contact application for managing family and acquaintances.
  

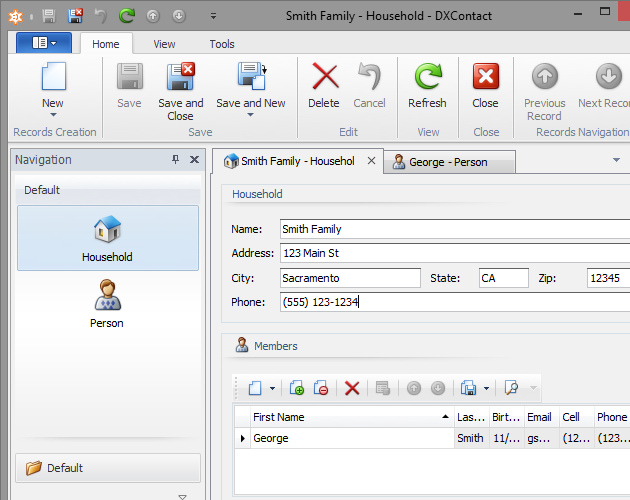
We will be creating a contact application from scratch, adding some additional functionality, and (if time permits) deploying to Azure Websites. A preview of the app:

XAF Contact Application

Finally, I wish I would have known/understood this powerful framework years ago! Register today!

As always, if there are any comments and/or questions, feel free to get a hold of me!

Seth Juarez
Email: sethj@devexpress.com
Twitter: @SethJuarez


Winforms Snap: Mail Merge, Parameters, and Sparklines (What’s New in 13.2)

$
0
0

It’s release season again! I am excited to start unveiling some of the great features we are pushing to release in 13.2. Today I thought I would mention Snap reporting. Reporting with Snap is primarily designed for those quick ad-hoc reports that we often need to prepare on a moments notice. By leveraging our built in knowledge of Word, the process of extracting and binding data is very straight-forward. Lets separate some of the new features in Snap into those categories.

Extracting Data

In our previous release we added a fantastic way for acquiring data directly from the database. In this release we are packing a bit more into this data acquisition process by including server side parameters and filtering.

Snap Query Builder

The query builder is inspired by our Dashboard component (same bits) and is another step along the way of having a seamless data acquisition process across all of our products. Adding parameters and filtering should also look familiar (think reports):

Parameters

Parameters

Filtering

Filtering

It is also worth mentioning that this type of filtering is server-side filtering. The server is precisely where these kinds of things (filtering, summarization, calculations, etc.) should happen. I am often amazed at how many people query a database for an entire table and then filter the resulting set on the client side. This is a recipe for sluggish applications. In the case of filtering we have done the heavy lifting on your behalf.

Binding Data

Snap provides a rich set of tools for automatically creating tabular reports in a sensible manner. You can drag any set of fields, drag it into the design surface, and have a completed tabular report. Previously a free flowing (non-tabular layout) required additional steps to achieve. Starting in 13.2 you can right click on the data source and change it to a mail-merge data source in order to do a free from report.

Mail Merge Setting

In order to give a visual indication of this important difference we’ve highlighted the fields in this manner:

Mail Merge Setting Indication

Once in Mail-Merge mode you can drag (or click) fields to add them to the current cursor position.

Merge Results

We have also added a toolbar to assist with Mail-Merge reports:

Mail Merge Toolbar

This should make a tremendous addition to our already powerful visualization and reporting tools.

In Summary

These two features are just a couple of things we’ve added to Snap. Included among these are the ability to add Sparklines, add new barcodes (DataBar and UPC ITF-14), a better API support for themes, and advanced binding to rtf/html fields.

As always, if there are any comments and/or questions, feel free to get a hold of me!

Seth Juarez
Email: sethj@devexpress.com
Twitter: @SethJuarez

Reporting: Pre-Printed Forms and the new ASP.NET Document Viewer Control (What’s New in 13.2)

$
0
0

Today I want to talk about two new features we are adding to our rich set of reporting tools in our upcoming 13.2 release.

Pre-Printed Forms

I recently taught a reporting class (there’s another one soon: sign up!) where one of the attendees mentioned frustration with creating reports based on pre-printed forms. These types of reports are very common. A great example of this type of form here in the US is the 1040 EZ tax form:

1040EZ Pre-Printed Form at Design Time

In our upcoming release we are making super easy to create these kinds of reports! Above you can see the 1040EZ form along with a couple of XRLabels used as placeholders for data. The way to get this to work is really simple:

  1. Create an image of your pre-printed form
  2. Set the image as the report watermark
    Watermake Dialog Box
  3. Set the DrawWatermark property of the report to true
    Draw Watermakr Property

Done! Now you can create a report based upon your specific forms with pinpoint accuracy in no time.

ASP.NET Document Viewer Control

This happens to be my favorite feature for reporting in this release. As we have been striving to eliminate the cruft from your development experience, we have done a number of consolidations when it comes to our WinForms End User Report Designer (last release) and have simplified some of the more common aspects of creating reports (creating tables, labels etc.). The new ASP.NET Document Viewer Control represents another step in that direction. In summary we went from this:

Old ASP.NET Reporting Controls

to this:

New ASP.NET Reporting Control

Here is our thinking – why should we require you, dear user, to drag 4 different things on to the design surface when really one will suffice. After all, it is the report itself which defines whether or not the parameters panel or the document map are needed. Now it is simply one control:

New Document Viewer at Design Time

There are a couple of other goodies that we have added to this control! The first is this notion of a Remote Report. When you click on that link you get the following dialog box:

Remote Report Dialog Box

Now the Document Viewer can connect directly to a report service or even the Report Server itself! Cut to the scene where the Report Server has a conversation with our new ASP.NET Document Viewer:

Report Server Talks to Document Viewer.

I will talk more about the implication of this approach later on when I delve into the new features of the Report Server.

The second thing we have added to the smart tag is a unified way of selecting a predefined theme. Here is the final report displayed in this brand new control with the Metropolis Blue theme:

Visualized Report in new Document Viewer

I am pretty excited about the direction we are taking with our analysis products. We are committed to simplifying the development experience while still providing robust data visualization tools at an affordable price.

As always, if there are any comments and/or questions, feel free to get a hold of me!

Seth Juarez
Email: sethj@devexpress.com
Twitter: @SethJuarez

DevExpress Charts: Data Aggregation, Legend Check Boxes, and Selection (What’s New in 13.2)

$
0
0

Visualizing data is probably one of the most fantastic things one can do. That is why charting is near and dear to my heart. As we continue to develop powerful visualization components we are proactively trying to make things simpler and easier to use.

With that in mind there are a couple of features that follow the spirit of these principles.

Automatic Data Aggregation (WinForms and ASP.NET)

Data Aggregation

Charts with a lot of data are ugly because the computer just happily draws everything you give it. There is seldom a case where this is what we want to do. Enter data aggregation. Starting in 13.2, a chart can automatically aggregate its data according to the specified Aggregate function:

Automatic Scale Mode

In addition, you can manually specify a Scale Mode and Measure Unit to control how data is aggregated:

Manual Scale Mode


This feature becomes extremely useful when used in conjunction with zooming and scrolling in WinForms charts. Now you can immediately see trends over large swaths of data and zoom in to a specific area to get a better look at localized trends.

This will now work with both numerical and time based arguments.

Legend Check Boxes (WinForms, ASP.NET, WPF, Silverlight)

I think this picture says it all:

Legend Check Boxes

I was going to write a thousand words but I think the ability to turn series off and on is fantastic. This will work for WinForms, ASP.NET, WPF, and Silverlight and is easily activated by setting the Legend.UseCheckBoxes property to true.

This feature is also available for strips, constant lines and financial indicators.

Selection (WPF and Silverlight)

Previously we had support for highlighting specific points in a WinForms/ASP.NET chart by using the chart's SetObjectSelection method. 

Starting in 13.2 you will now have this ability in our WPF and Silverlight Charts. We've added the ChartControl.SelectedItem and ChartControl.SelectedItems properties and fully implemented the MVVM pattern for giving you the full power of WPF binding.

In Conclusion

This is by no means everything we’ve done for this release. I’ve left out a couple of things (including some neat mapping features I will talk about later).

As we continue to drive forward with our data visualization tools, we are confident that you will find incremental improvements that will simplify your process of acquiring, shaping, and visualizing your data.

As always, if there are any comments and/or questions, feel free to get a hold of me!

Seth Juarez
Email: sethj@devexpress.com
Twitter: @SethJuarez

DevExpress PDF: Working with Pdf Files in Code (What’s New in 13.2)

$
0
0

DevExpress PDF Viewer

In 13.1 we released a beta for our new pdf viewer. This excellent addition to our control suite enables an in app viewing experience for your pdf documents. Given that these documents can be loaded by filename or even from a stream of bits, you have the ultimate flexibility in loading and displaying pdf documents in a controlled manner.

Consider the scenario, however, where you have hundreds (or thousands+) of pdf documents. Invariably the boss might one day ask for that one pdf document with specific text (any lawyers out there?). How does one efficiently search these documents without going opening each and every document? Starting in 13.2 we are greatly increasing your ability to manage and work with these documents within code.

var search = "parameters";
PdfDocumentProcessor processor = new PdfDocumentProcessor();
processor.LoadDocument("CSharpSpec.pdf");
var searchParams = new PdfTextSearchParameters
{
    CaseSensitive = false,
    WholeWords = true
};

var results = processor.FindText(search, searchParams);
while (results.Status == PdfTextSearchStatus.Found)
{
    var text = string.Join(", ",
                    results.Words.Select(p => p.Text).ToArray());

    Console.WriteLine("Found \"{0}\" on page {1}",
        text,
        results.PageIndex);

    results = processor.FindText(search, searchParams);
}

Console.WriteLine("That's all folks!");
Console.ReadKey();

Notice how easy it is to load up a pdf document processor and search for specific text. Now imagine doing this across your entire library of pdf documents!

Working with PDFs in Code

In the age of “big data” it is imperative that we, as developers, have the ability work with any type of data: be it structured or unstructured. Indeed the best way to derive the greatest value from our data is the ability to handle it all at once. I think this tool will greatly help with pdfs!

As always, if there are any comments and/or questions, feel free to get a hold of me!

Seth Juarez
Email: sethj@devexpress.com
Twitter: @SethJuarez

DevExpress Report Server: Mixed Mode, Stored Procedures, Templates, and More! (What’s New in 13.2)

$
0
0

I am excited to announce a couple of features that we’ve added to the DevExpress Report Server for our upcoming 13.2 release. The Report Server is one of the few products in the storied history of DevExpress releases where I’ve had input from its inception. I was there when we had the idea, pitched it to the company (yes we do that – maybe I should say more in a separate blog post), and released the first version. As the product continues to mature (with your excellent feedback) we feel that this is one of the most powerful and affordable ways of doing no-touch on-premise reporting. Let’s dive into some of the new features.

Mixed Mode

Previously the DevExpress Report Server would only function in either Windows Authentication Mode or Report Server Authentication mode. Now you can have both with “Mixed Mode” authentication:

Mixed Mode Settings

When in “Mixed Mode” users will now be able to choose how to log in:

Mixed Mode Login

In essence you can now allow both Windows Domain users as well as remote users with Report Server Credentials.

Stored Procedures

An often repeated feature request was the ability to seamlessly bind to result sets returned from executing stored procedures. I am happy to announce that starting in 13.2 you will now have the option to do so:

Adding Stored Procedures

Once bound the DevExpress Report Server will also display the available fields:

Stored Procedure View

The DevExpress Report Server also seamlessly handles the parameters that naturally come with using stored procedures. These parameters are automatically generated at design time (for preview purposes) as well as at report generation time (specifically when creating tasks):

Task Parameters

I think you will like the new store procedure binding experience.

Email Templates

The DevExpress Report Server sends out a number of emails to inform users of various events such as account activation, scheduled report completion, etc. These emails are quite bland. Starting in 13.2 you now have the ability to make them even uglier more beautiful! There are a number of email templates that you can now edit as part of the Server Settings:

Available Email Templates

Some of them (like most email subjects) are simple text boxes; others are much more:

Editing Email Templates

This was also one of the more requested features (we do listen).

Miscellany

Another interesting feature that we’ve added in 13.2 is the ability to select report delivery options:

Report Delivery Options

This is perfect for the case where the DevExpress Report Server is running in an internal network but reports need to be delivered to folks outside of the network: they no longer have to log on to the Report Server to view reports.

We’ve also made a number of usability improvements which I’ll let you discover as you upgrade and begin using the DevExpress Report Server. We are really excited to be pushing the boundaries between pure developer tools and end user tools: sometimes the best way to save on development time is to remove the necessity of development time.

As always, if there are any comments and/or questions, feel free to get a hold of me!

Seth Juarez
Email: sethj@devexpress.com
Twitter: @SethJuarez

Windows Spreadsheets: Charting Support and More (What’s New in 13.2)

$
0
0

There are a metric ton of fantastic features that we are adding to our spreadsheet control for windows (both WinForms and now WPF).

Charts

I am happy to announce that starting in 13.2 we have integrated charting directly into our spreadsheet control:

Spreadsheet Charts

All you have to do is highlight some data, insert a chart, and that’s it!

Chart Options

Once inserted you can change the chart type, modify the layout, and even change the chart theme via the design ribbon tab. In addition to the design tab, we also have a layout tab which allows even more fine grained control over the chart:

Chart Layout

Often when analyzing data it is sometimes easier to give the data to our end users and allow them the opportunity to shape and visualize data however they choose. This type of control will undoubtedly help provide insight to your customer’s data in a familiar way.

More

There are tons of other usability features which we have snuck in to 13.2 release that provide the traditional experience one has come to expect from spreadsheet software. I will only mention four (there really isn’t enough space).

Number Formatting

We have created a really intuitive way of formatting numbers:

Number Formatting

Formula Bar and Name Box

These additional controls help identify the current cell address, table name, or defined name under consideration (Name Box). The Formula Bar allows your end users to edit formulas (like they otherwise would in other spreadsheet tools).

formula

Formatting

Formatting

Conditional Formatting

conditional

Finally

There are a bunch of other things I am leaving out (for now). Overall this is going to be a pretty exciting release: especially for those providing spreadsheet solutions directly in their applications.

As always, if there are any comments and/or questions, feel free to get a hold of me!

Seth Juarez
Email: sethj@devexpress.com
Twitter: @SethJuarez

DevExpress Dashboards: Visual Studio Integration, Server Side Parameters, and New API (What’s New in 13.2)

$
0
0

We have done a great deal of work on our dashboard tool for both Windows and the Web. While I can’t detail every new feature, I thought I would mention 3 new developer friendly things available starting in our 13.2 release.

Visual Studio Integration

In this release you’ll now be able to build dashboards directly in Visual Studio. The process is pretty straight forward.

Add a Dashboard via the Template Gallery

Literally right click and select Add New DevExpress Item and the wizard appears.

Dashboard Template Gallery Item

Add Data Source

Once the designer loads up you can use the new Dashboard Visual Studio menu item to add/edit the available Data Sources.

Edit Dashboard Data Sources

Data Source Types

As you know, our dashboards bind directly to your database or to an internal project data source.

Two Dashboard Data Source Types

As you can see we have added UI in an effort to simplify both of these cases.

Build Your Dashboard

Full Visual Studio Dashboard Integration

Once bound you can create your dashboard layout just as you did before. In Visual Studio, however, you have more fine-grained control through the use of the standard property editor available in the IDE.

Creating a Dashboard Preview

Just like a DevExpress Report, a dashboard is just a set of files that can be edited directly in Visual Studio:

Dashboard Files

Just like reports, you can also set the dashboard source at design time (once you compile).

Setting Dashboard Viewer Source

Overall the Visual Studio experience is intended to be both simple and familiar so you can be effective the moment you install the product.

Server Side Filtering with Parameters

This was a highly requested feature! Even though previous versions could handle server side filtering, it was cumbersome and required a bit of code. Starting in 13.2 you can customize a Dashboard Data Source to do server side filtering  using the new parameters feature.

Dashboard Query Designer

When using the Dashboard Data Source Wizard, there are now two additional buttons: one for parameters and one for filtering. The notion of parameters in dashboards is virtually identical to parameters in reports. In this case they can be used to directly filter data on the server side with the aid of the Filter Editor:

Server Side Parameters and Filters

In essence you create the parameters you want and then add the filters using the filter editor. Then at design time (and runtime) you can populate the parameters to push the filtering to the server.

Setting Dashboard Filter at Design Time

This can be achieved by clicking in the dashboard title area (the question mark to the right of “Dashboard”) and typing in the desired parameter value.

Better API

Here’s another thing a lot of developers were itching to get their hands on!

Dashboard Viewer Events

We have added a number of events to the dashboard viewers that should allow programmatic control over the most important aspects of your visualization. Here are a couple:

  1. DashboardViewer.MasterFilterSet – control what happens when a master filter is set
  2. DashboardViewer.MasterFilterCleared – control what happens when a master filter is cleared
  3. DashboardViewer.DrillDownPerformed – control what happens when a drill down is performed
  4. DashboardViewer.DrillUpPerformed – control what happens when a drill up is performed

For each event, there event parameter (e.DashboardItemName) that will identify exactly which dashboard item raised the event as well as other important ancillary information such as selected values, ranges, drill-X path’s, level’s, etc. In short, complete control.

Conclusion

This is not everything of course. We have also added new map dashboard items (I will go in depth on these later), multi-selection in master filters, and much more. This is shaping up to be an exciting release!

As always, if there are any comments and/or questions, feel free to get a hold of me!

Seth Juarez
Email: sethj@devexpress.com
Twitter: @SethJuarez


Winforms Snap: Mail-Merge In Depth

$
0
0

Previously I outlined some of the more interesting features that were released in Snap reporting for our 13.2 release cycle (including mail-merge). I thought it would be interesting to take a detailed approach at the Snap mail merge features to show you the power that we’ve added to an already rich product. We’ll first start with the general merge process and then sprinkle in what Snap adds to the mix.

Traditionally the mail-merge process consists of 4 general steps:

  1. Creating a template document,
  2. Selecting a data source,
  3. Adding merge fields to the document, and
  4. Merging the data with the template document

With Snap this is pretty simple. So what is different/better? Let’s look at three things: master-detail, in-place filtering, and navigation/sort/preview.

Master-Detail Mail-Merge

Turning a document into a mail-merge template is performed by enabling this mode for one of the connected data sources.

Setting Mail Merge

In the resulting document, the whole of the static content becomes wrapped around any inserted merge field. When merging a finished document, the static template is repeated with each record supplied by the corresponding merge field’s data source. This is in contrast to creating regular Snap reports, where an inserted field instantly unfolds to list all of its data records within the document body.

When performing a master-detail mail-merge we’ve combined the best of two worlds. Within a master-detail structure of a report, Snap derives a field's role from its level in the data source hierarchy.

Master Report: Merge Fields

When inserted from a hierarchical data source, fields that belong to its top level are attributed to the "master" section of a template. To blend with the rest of report content, the data from these merge fields is inserted as inline text.

Merge Fields

Detail Report: Data Fields

Fields that belong to nested levels of a data source form part of the "detail" document section. Inserted to a template, such data field is displayed as a list conveying the rows of underlying data records.

Detail Fields

In a document structure, this template is reproduced with each new occurrence of data rows belonging to the "master" section, to accompany it with a corresponding accessory data.

Data fields that belong to the same hierarchical level add up to create a document table with multiple columns. For further arrangement of data, Snap tables support automatic summaries, sorting, grouping, and filtering.

In-Place Filtering

Once the Snap template is created and bound, the need arises for creating filters to narrow the data displayed. With Snap there are two filtering options: quick filter and the expression filter.

Quick Filter

Quick Filter

Quick filtering is exactly what you’d expect – pick records by their name. All you need to do is select the element in question on the Snap design surface and the quick filter dialog box replaces the items with the distinct set of the item in question. In this case I’ve highlighted the country field in order for the quick-filter selection to include the list of countries.

Expression Filter

When simple record selection is not enough, you can easily create any complex expression using the following dialog:

Expression Filter

This editor allows for the creation of any criteria with any available fields.

Navigation, Sorting, and Preview

Lastly I wanted to talk about navigation, sorting, and preview. Navigation is simply a case of selecting the appropriate record you wish to display.

Record Navigation

To the left of the navigation controls you can bring up the Sort dialog box to order records based on any field (or sub-field in the master-detail case) available from the data source.

Record Sorting

To publish a report, you have the following options:

  1. send it to a printer;
  2. export to a third-party document format (such as doc, docx, rtf, odt, html, pdf, etc.);
  3. display the document on-screen in a Print Preview window.

Once one of these options is selected, you further have the ability to select which records to publish as well as how to separate each record.

Snap Export Options

We also are careful to process the actual document assembly to an entirely separate thread. This ensures snappy response and avoids lock-ups.

Asynchronous Merging

This process produces a clear preview based on our award winning reporting tool.

Print Preview

Summary

Overall Snap is truly a remarkable no-touch reporting tool that can be easily embedded in your WinForms applications.

As always, if there are any comments and/or questions, feel free to get a hold of me!

Seth Juarez
Email: sethj@devexpress.com
Twitter: @SethJuarez

BASTA 2014 and Mixer

$
0
0

I was extremely fortunate to attend BASTA 2014 in Darmstadt. Germany is a wonderful place full of extremely intelligent developers building amazing things. One of my objectives is to learn about what folks are building with our products and to find ways we can improve.

Me

Oliver (our Training Director) was on hand to provide great technical content (in German no less).

Oliver Sturm

John Martin was also in attendance (he works closely with developers in Germany and is a seriously awesome colleague):

John Martin

Oliver and I had a series of talks at the conference as well. To be honest, I had one talk and he had 200 or so (if I remember correctly).

One of the highlights of the event was our Customer Mixer. We invited customers from all over Germany to spend some time with us talking about what they are building and how we can improve our products in general. It was probably one of the best parts of the trip: speaking and interacting one-on-one with each and every customer.

Mixer Part 1

I seriously think I managed to speak to everyone there:

Mixer Part 2

There are tons more pictures if you would like to have a look.

If you are interested in us coming out to an event let me know! I am anxious to really get into how our products are actually being used (as opposed to the awesome demoware I manage to create on a daily basis).

As always, if there are any comments and/or questions, feel free to get a hold of me!

Seth Juarez
Email: sethj@devexpress.com
Twitter: @SethJuarez

What's New in 13.2.8 for the .NET DevExpress Dashboard

$
0
0

We’ve managed to sneak a couple of features into our dashboard offering in our next minor release!

Filter Popup

Filter Popup

We recognize that a dashboard is sort of a living report with many filters often created and executed. Instead of cluttering the title space we’ve added a new popup describing the active filters currently set for the entire dashboard. In the case above this particular dashboard has a filter set on the ticket type as well as a selected state (off screen in this instance).

Printing

Print Preview Options

We’ve also added a couple of print preview tools to fine tune the type of output you would like to see when printing. Above you can see the new Dashboard Print options. Below you can see the new Header/Footer options.

Print Preview Header and Footer Options

These header/footer options allow not only the insertion of custom text (to the left, middle, or right), but also allow for “calculated” text. This type of “calculated” text includes the current, date, user, page number etc.

Exporting

Previously our export options were non-existent (we let you choose a file name). We have beefed up our PDF export options:

Dashboard PDF Export Options

We’ve also updated (added really) options for exporting the dashboard as an image:

Dashboard Image Export Options

One feature of interest is the Filter State. When checked this creates a view into the current state of the dashboard:

filter_state

Overall a big boost for exporting the dashboards you create.

Data Items Area Improvements

This is by far my favorite addition. Take a look:

Group and Item Movement in Data Items Section

Moving things around in the Data Items  section proved to be extremely difficult until this release. We have added the ability to move around items in the Data Items area by simply, well, moving them around. Notice that there are essentially two ways of moving things in the Data Items section: by group or by field. Moving by group essentially moves the entire collection of elements within the group to a different position. One can also move an element of a particular group out to its own area. Like I said, one of my favorite additions: it should certainly shorten the amount of time we spend experimenting with just the right layout.

Final Words

Overall I’m pretty excited with our dashboard product. We are continually making great strides in making this a truly remarkable tool for exploring and understanding data.

As always, if there are any comments and/or questions, feel free to get a hold of me!

Seth Juarez
Email: sethj@devexpress.com
Twitter: @SethJuarez

Build 2014–Day One Observations

$
0
0

I thought I should jot down a couple of observations from Day 1 here at Build 2014. Would love your thoughts! Apologies for some of the blurry images up front.

Windows Phone 8.1 Update

While there was a ton of time spent on discussing the Windows Phone update, I thought the most interesting thing discussed was Cortana, the new Microsoft Digital Assistant. A lot of thought went into its implementation and it shows. It was designed to learn about the user in order to be more effective at displaying the right information at the right time. Two examples I think cut to the heart of it: context whittling (my term) and person based tasks. Context whittling is a situation where an additional query to Cortana on an already queried set returns a more refined result. In other words the context can be shrunk with each additional query. Person based tasks are tasks issued to Cortana based around a particular person. Whenever that person comes into context, Cortana reminds the user of a task related to the person in question.

In addition to Cortana, a slew of new devices were announced by Stephen Elop:

Lumia 930

Lumia 630/635

Windows 8.1 Update

The next update to Windows is slated to contain a number of features designed to improve support for the keyboard and mouse. The first is an improved start screen:

Windows Start Screen

In addition to the new start screen efforts have been made to have a more desktop-friendly approach to apps: these will also run from the task bar and execute as normal apps. Early complaints regarding the fragmentation of the desktop experience appear to have resonated with Microsoft enough to make these important changes. Finally, enough noise was made about the start menu that it will one day make its way back into the OS for good (still a prototype):

Windows 8 Start Menu

Universal Windows Apps

This portion of the keynote resonated with me primarily because it reminded me of XAF. Instead of targeting Windows and Web, UWA’s (I like to pronounce it yewas because I can) target both the Windows 8 device as well as the Windows 8 Phone device using a shared codebase. This also includes specific Visual Studio tooling to work with the shared and non-shared code.

Uiversal Windows App

This is only the beginning of it: Microsoft is also currently working on extending this type of application development to the XBox.

Office Touch

Microsoft announced their work on a Touch-Based office for Windows 8.

PowerPoint Touch

I personally love this application. It is clearly touch friendly and a great deal of effort was put into making the ribbon more touch friendly without sacrificing space.

Summary

There were obviously a bunch of other things mentioned (internet of things, more phone features, open sourcing WinJS, etc.) in the keynote that I’ll leave for another time. The overwhelming feeling was one of optimism – a far cry from the first Build to say the least. Microsoft feels more open and developer friendly. Satya Nadella (Microsoft CEO) even showed up in a t-shirt and jeans to answer honest-to-goodness difficult questions (why should I choose to build for Windows Phone instead of Android?) in an open and conversational manner. They also spent a great deal of time discussing roadmap-type stuff. My feeling is that if Microsoft wants the Enterprise on board with what they are doing they should at least give them a heads-up (something Microsoft did today).

Last and most important: Microsoft now realizes that it can no longer rely on revenue from the OS (particularly on devices 9” and smaller). In fact, it will no longer be selling the software but giving it away for free. While this was not necessarily trumpeted, I think it is a critical departure from Microsoft’s OS centric past to a device and service based future.

We’ve had tons of folks stop by to chat and take a look at what we offer as well.

DevExpress Booth

It has been great learning what our customers are developing and what our potential customers are keen on creating.

On to Day 2!

As always, if there are any comments and/or questions, feel free to get a hold of me!

Seth Juarez
Email: sethj@devexpress.com
Twitter: @SethJuarez

Build 2014–Day Two Observations

$
0
0

After the conclusion of an eventful day two here at Build, I thought I would share some insight into what I thought it all meant. In a nutshell, we live in a post OS world and Microsoft is embracing it with Azure it while maintaining its flagship compiler in an interestingly new way. Let me elaborate a bit.

.NET

It is hard to grasp the entire reality of what Roslyn actually means for .NET. If a static language is a house, the compiler is its foundation. What Microsoft in effect did with the Roslyn project is pick up the house and build a new foundation while attempting to maintain the integrity of the walls. My sources tell me that every single .NET product in Microsoft is now compiled using Roslyn. This is a remarkable feat. To one-up themselves, they decided to go ahead and open source the entire Roslyn compiler. The first and obvious question is “why?” In an interview with Mads Torgersen (more on that later) he mentioned that doing so would allow folks to do more interesting things not only with the languages themselves, but with how the languages interact within Visual Studio. In other words, partners would have the same advantages as Microsoft when building tooling around Visual Studio.

.NET Foundation

Also, with the creation of the .NET foundation, anyone can contribute to .NET making it a truly vibrant and potentially innovative platform for development. Notice that at the forefront of the list of those in the .NET community is Miguel de Icaza. At Mix 11 I remember he coined the phrase “We love C# more than Microsoft does.” I believe that is no longer the case. It seems to me that for truly native device experiences Microsoft is putting all of its support behind Xamarin.

Xamarin Session

What you see above is not a keynote, it is a regular conference session with a little less than 1200 in attendance. It is clear that not only is Microsoft putting its stamp of approval on the Xamarin approach, but the Microsoft community is eager to use .NET to deliver multi-device experiences.

Windows Azure

In yesterday’s summary I mentioned that we live in a post OS world. Devices are becoming the ubiquitous computing platform of choice for completing quick every day tasks. Yesterday we saw devices 9” and smaller get an incredible offer: a free OS. While this seems completely contradictory, Microsoft has “reimagined” (to use their favorite term) the OS in a non-OS way.

Microsoft today announced a number of IaaS and PaaS improvements and features that make Azure the ultimate OS with devices being the new “programs” so-to-speak. Just like windows of yore welcomed programs from really any source (including competitors), they are now embracing devices in exactly the same way. They are making it easy to create the backend infrastructure to support these devices in a pretty amazing way. Never in my life could I have imagined a John Gruber presentation during a Microsoft keynote; yet nonetheless there it was. It turns out that if John himself wants to build a killer app with cloud persistence he really can only turn to Amazon or Microsoft – Apple can’t help. While IaaS is interesting, it’s PaaS that is compelling to me. On that front Microsoft made announcements for Web, Mobile, and Data use cases in the cloud.

Web Announcements

For web anyone can now easily scale a website, manage traffic, backup, and run long running jobs pretty easily directly from Visual Studio. Many of these features were previously in beta mode.

Mobile Announcements

Azure as a mobile backend handles a ton of functionality that would otherwise be difficult for a small shop to administer.

Data Announcements

And finally Azure as a repository of data is a compelling alternative.

The idea that the cloud was the new Microsoft OS dawned on me when I looked at this:

Azure Portal

It looks like the control panel (or task manager) for an OS! While this is not a revelation to some, it has become clear to me that this is really the only play Microsoft has: it also turns out to be the best one.

Summary

What does this mean for you dear DevExpress reader? I think it means it is an exciting time to be a developer in the .NET space. I also think it is a great opportunity for you to leverage some of the innovations we have been building into more traditional .NET technologies that are designed to bridge the gap between your current investments and the new directions Microsoft is taking.

As always, if there are any comments and/or questions, feel free to get a hold of me!

Seth Juarez
Email: sethj@devexpress.com
Twitter: @SethJuarez

Build 2014 Recap: S. Somasegar Interview

$
0
0

One of the best parts of attending Microsoft conferences is the access we have to the people building the very tools we use day in and day out. S. Somasegar is the Corporate Vice President of the Developer Division at Microsoft. I was delighted to spend some time asking questions about some of the interesting announcements at BUILD 2014. Topics varied from Universal Windows Apps to open sourcing C#. We also talked about some of the fantastic developments with Azure and how they have improved their PaaS offerings. We also discussed what Microsoft intends to do to support those of us still on ASP.NET WebForms as well as WinForms. Would love your thoughts about what he said as well as the overall direction Microsoft is taking. As I have mentioned in earlier posts, I really like the new openness Microsoft is espousing with its developers. Enjoy!

As always, if there are any comments and/or questions, feel free to get a hold of me!

Seth Juarez
Email: sethj@devexpress.com
Twitter: @SethJuarez

Charting: New Chart Types, WPF Improvements and Simplified Display Options (Coming soon in v14.1)

$
0
0

As we near 14.1 release time I wanted to show you a couple of great features we are adding to our charting offering.

Nested Donut Series View

Nested Donut Series View

In this particular case we are looking at a number of data points at the same time. The inner and outer donuts represent the female and male population respectively. Additionally the donuts are further subdivided by age. Finally each donut represents a country. In the case of Brazil notice that the female to male ratio of the 15-64 age group is almost equal. The purpose of any good visualization is to provide a large amount of information at a glance. Using the nested donut judiciously should indeed help elucidate data in a concise manner.

This new series view is available WinForms, ASP.NET, WPF, and Silverlight

WinForms Chart Range Control

Chart Range Control Client

This particular client of the range control both informs and performs. I am a fan of using all available space when laying out informative and functional UI.

WPF/Silverlight Improvements

As we continue to improve our charting experience there are features which make it into one product group but don’t make it into the other. Two features previously available in WinForms will now be made available in WPF as well. These are automatic data aggregation and Funnel Series view.

WPF Data Aggregation

Here’s a look at your funnel view:

WPF Funnel View

This type of visualization is great to see how things “whittle” down over a particular process.

Text Patterns (Previously Series Points Options)

The best way to explain this is to look at the before and after:

13.2

13.2 Point Options

When it comes to editing the way points are displayed, our 13.2 release did not allow custom formats to be used when displaying items.

14.1

14.1 Point Options

Notice that the 14.1 release changes the flexibility dramatically. All standard .NET formatting can now be used to change the way any portion of the point labels are displayed.

Overall I think it is a significant improvement and adds a breadth of options when displaying data effectively. It is also important to note that these options work across all platforms.

Parting Words

Overall I think we’ve got a number of exciting things happening with our charting toolset. There is yet a lot of innovation to come!

As always, if there are any comments and/or questions, feel free to get a hold of me!

Seth Juarez
Email: sethj@devexpress.com
Twitter: @SethJuarez


Kansas City Developer Conference 2014–Come See Me!

$
0
0

Kansa City Developer ConferenceI’m pretty excited to be heading out to Kansas City right after our stint at TechEd (take a look at what Mehul had to say on that). One of my favorite parts of what I do involves getting out and speaking to developers regarding their data visualization and analysis needs. I will also come with our freshest (and unreleased 14.1) bits to give you a sampling of some of the great things we plan to feature in our upcoming release. Please stop by with your questions/issues/suggestions.

I am also happy to say that I get to give a few talks:

Dashboarding: The Developers Role in Data Analysis, and

Practical Machine Learning.

The first talk involves understanding data visualization principles in order to maximize the potential of our dashboards. It is a product agnostic talk that really focuses on the essence of what a dashboard is and what you should embrace and avoid.

The second talk is a gentle introduction to machine learning. In essence we will be looking at building a recommendation engine as well as implementing anomaly detection. A recommender system is pretty self explanatory (we use them all of the time). Anomaly detection is the process whereby a machine detects abnormal patters in a sequence of events. It should be a lot of fun.

Per their site, “The Kansas City Developer Conference, a Kansas City based non-profit, is pleased to announce our 6th annual event. The event is on the 15th, 16th & 17th of May, 2014 and will be held at the Kansas City Convention Center in downtown Kansas City.”

There is still time to register! If you can’t attend but would like to visit with us (Amanda is coming as well) just drop me a note so we can make arrangements.

As always, if there are any comments and/or questions, feel free to get a hold of me!

Seth Juarez
Email: sethj@devexpress.com
Twitter: @SethJuarez

Reporting: Improved Data Access (Coming soon in v14.1)

$
0
0

While I’m here at TechEd I thought I would show you some of the great features we are adding in our 14.1 series of releases. In this release we have seriously put a lot of legwork into making the process of creating reports much simpler from the perspective of data access. We have taken a cue from the work we have done with dashboards and brought it over into our reporting suite.

Data Wizard

Creating a new XtraReport will display the following window inside of Visual Studio (in the End User Designer we omit the Inherited Report option):

XtraReport Wizard

This new approach makes it easy to connect to your database directly or through EF5/EF6.
Now one can directly specify a connection string (that can be saved as part of the project).

XtraReports Data Options

This wizard can connect to 14 or so different data providers without any effort really. I think the most interesting bit is that we completely co-opted the dashboard query builder to allow a good range of flexibility for shaping your data.

XtraReports Query Designer

That’s right! You can completely dispense with creating a dataset (or any database object).

Relationships

As a reporting platform we take great pride in having our toolset conform to the data you provide. In this particular instance a single query does not provide the adequate infrastructure to do true master-detail reports (not the fake flattened ones). In this case we’ve provided the ability to add queries directly onto the data source:

Add Query Command

Adding a query really just fires up the query builder and creates an additional table from which you can bind. The key goodness lies in the ability to *relate* the queries to create a true master-detail relationship.

Manage Query Relations

Once this is done the Field List reflects the changes as you would expect.

Report Field List

These relationships are also understood when creating Detail Report bands:

Adding Detail Band with Relationship

In Closing

These features will greatly speed up the process of creating powerful reports in a matter of minutes. Another good bit of news: these features are also included in the WinForms End User Designer. This allows you to offload the entire process of creating reports to those who are most interested and willing.

There are a number of other things in the works so stay tuned.

As always, if there are any comments and/or questions, feel free to get a hold of me!

Seth Juarez
Email: sethj@devexpress.com
Twitter: @SethJuarez

Reporting: New Web End User Designer (Coming soon in v14.1)

$
0
0

You might have heard we are (finally) releasing an end user designer for the web. I’ve been wanting this gem for years! Imagine being able to manage reports (create, edit, view) all from the web! We promised more details so I’m here to spill the beans.

Technology

Web End User Report Designer
Under the hood it is a pure html5/js application that we’ve wrapped in an ASP.NET control. We relied heavily on Knockout for the actual binding mechanism on the control. In fact, the developers were pretty excited when they were showing me how the bindings did almost all of the heavy lifting in the component. We decided to wrap the initial version in an ASP.NET control simply because it is what our customers use. Will we release a pure html5/js version? Maybe: we’re not to that point yet. Which brings me to the next bit of information.

Community Technology Preview

This is a Community Technology Preview (or beta) of this new reporting technology. This means that it might still have some hiccups. This means that some of your reports might not work. This means we really want your input and feedback. It also means that you can get your hands on it a lot earlier too!

What’s In?

So here’s what we do support:

  • Design Surface: rulers, controls selection (using mouse or keyboard, including multiselect and select with ctrl-key), drag-drop, resize, margins resizing, band selection, resizing, and collapsing, snap during control dragging (to other controls/margins)
    Design Surface
  • Toolbar: copy/paste, undo/redo, zooming
    Toolbar
  • Toolbox: XRLabel, XRRichText, XRCrossBandLine, XRCrossBandBox, XRPanel, XRTable, XRPictureBox, XRPageBreak, XRPageInfo, XRLine, XRShape, XRCheckBox, XRSparkline 
    toolbox
  • Property Grid: grouped editors for currently selected object, which supports not at all, but most of used properties - font, color, styles, margins/paddings, bindings, data sources, sort/group fields
    Property Grid
  • Field List: data source structure, with possibility to drag field on the design surface with automatic binding
    Field List
  • Parameters Panel: add/edit/remove parameters
    Parameters Panel

What’s Out?

There are a one thing that we deliberately left out and a couple of things we still want to implement.

  • Report Explorer Panel: We felt this would be fairly redundant given our new approach to band visualization.
    Band Explorer 
  • Missing Controls: XRChart, XRSparkline, XRPivotGrid - these controls cannot be currently edited so they are simply represented as a box with a title on the design surface.

We will continue to work on these complex report controls and hope to have news about their implementation soon (that is a “marketing” soon if you know what I mean).

Working With the WEUD

Setup is extremely easy. I simply created an empty Web Project using our handy DevExpress Template Gallery and added a run-of-the-mill report (ProductReport). Next I added a new WebForm and dropped the WEUD control on the design surface.

ASPXReportDesigner Control

Next you need to add this ridiculously long code snippet (joking):

Loading a Report

Done! The designer should render as shown above (at the beginning of the article).

Saving Reports

This would be a horrible component if it did not provide a way to save the report. The WEUD provides a save button at the top left hand side of the designer itself.

Saving a Report

A corresponding event is fired wherein you can get a hold of the report layout and do pretty much whatever you like:

Saving a Report with Code

Final Thoughts

Like I said before, we are extemely excited about the new possibilities this will bring to your already powerful applications. Please (please, please) send me your feedback. We feel this is a monumental tool we are introducing and want to get it absolutely right.

As always, if there are any comments and/or questions, feel free to get a hold of me!

Seth Juarez
Email: sethj@devexpress.com
Twitter: @SethJuarez

Windows Spreadsheet: Name Manager and Data Protection (Coming soon in v14.1)

$
0
0

I thought I would elaborate a bit more on two of the new features we are introducing in our Windows Spreadsheet offering coming in 14.1.

Name Manager

This feature is quite simple actually: it lets you create a grouping of cells that can be used under a single name.

Range Naming

Once the name is created, this name can be used within pretty much any function.

Named Function

This is a great feature for simplifying complex formulas or for simply keeping track of different sets of data within your spreadsheet.

Data Protection

As Julian pointed out, we are adding worksheet and workbook protection. Setting this up is quite simple: one need simply click on Protect Sheet or Protect Workbook and set a password.

Sheet Protection

Once protections have been set, the user will be unable to make changes unless the worksheet or workbook is set to unprotected mode. Additionally, you can set a password that can be used to unlock the protected sheet/workbook.

Unprotect Sheet

Let’s get a bit more in depth about range protection. In this release you can create a set of ranges that are individually protected.

Range Protection

Once a sheet (or workbook) is protected, the edit ranges can be activated by supplying the appropriate password (for this specific range):

Unlock Range

These features combined create the ability to protect your spreadsheet from a macro (workbook/spreadsheet) down to the micro (range protection) level.

Final Thoughts

Spreadsheets are indeed one of the rare pieces of software that have endured the test of time. In the next couple of posts I will take a more in depth look at the new Chart Object Model and API as well as a new feature in spreadsheets that Julian did not mention: it is pretty fantastic.

As always, if there are any comments and/or questions, feel free to get a hold of me!

Seth Juarez
Email: sethj@devexpress.com
Twitter: @SethJuarez

Spreadsheet Control Chart API (Coming soon in v14.1)

$
0
0

When it comes down to it, I am a programmer. That is what I went to school for: it’s what I like to do. While wizards and drag-and-drop are really cool, sometimes we just want to get down to the code and do things ourselves. This is particularly true when we want to generate certain types of documents like Word Documents, PDF’s, or spreadsheets. In upcoming release of .NET Spreadsheet control we introduce a new API which allows to create or modify embedded charts programmatically.

Using Spreadsheet Chart API you can:

  • Create new chart of predefined type (Bar/Column, Line, Pie, etc.) using data from specified cell range;
  • Enumerate existing charts embedded to worksheet;
  • Find existing chart by id or name;
  • Setup chart Z-order and position (using cells as anchor points);
  • Change chart type, select data from cell range or specify literal data, toggle row/column data;
  • Add, remove, reorder chart series, change series type or data references;
  • Adjust axis properties (like position, orientation, scaling, min/max values, etc.);
  • Adjust chart and axis titles;
  • Apply predefined style to whole chart or adjust formatting (fill, outline, font) of chart objects (plot area, legend, series, data points);
  • Adjust data labels, markers, trend lines, error bars, etc.;
  • Copy chart to another worksheet.

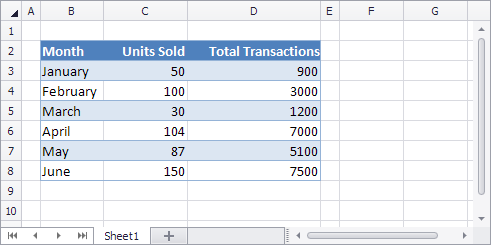
For example, let’s create complex chart based on the following data:

Data

First, add a couple of namespaces:

using DevExpress.Spreadsheet;
using DevExpress.Spreadsheet.Charts;
using DevExpress.Spreadsheet.Drawings;

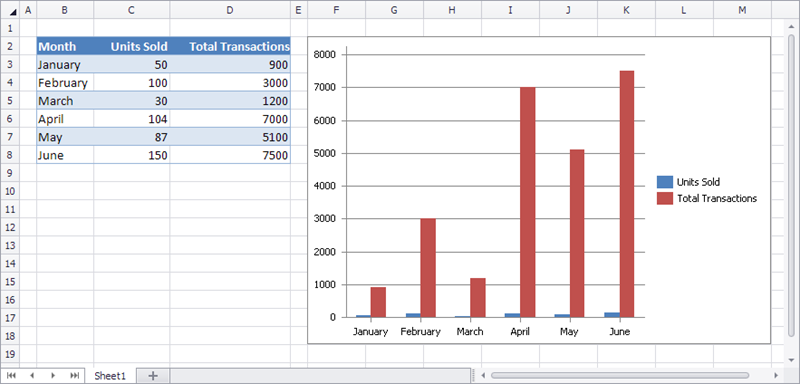
Next create column clustered chart using data from specified cell range:

IWorkbook workbook = spreadsheetControl1.Document;
Worksheet worksheet = workbook.Worksheets.ActiveWorksheet;

Chart chart = worksheet.Charts.Add(ChartType.ColumnClustered, worksheet["B2:D8"]);

And setup chart position:

chart.TopLeftCell = worksheet.Cells["F2"];
chart.BottomRightCell = worksheet.Cells["M18"];

Basic Chart

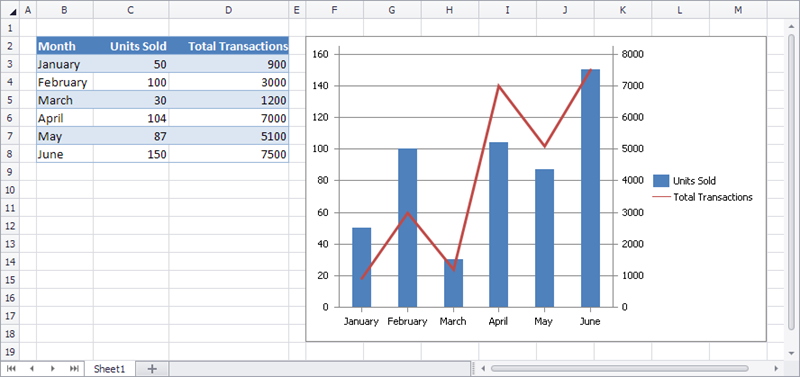
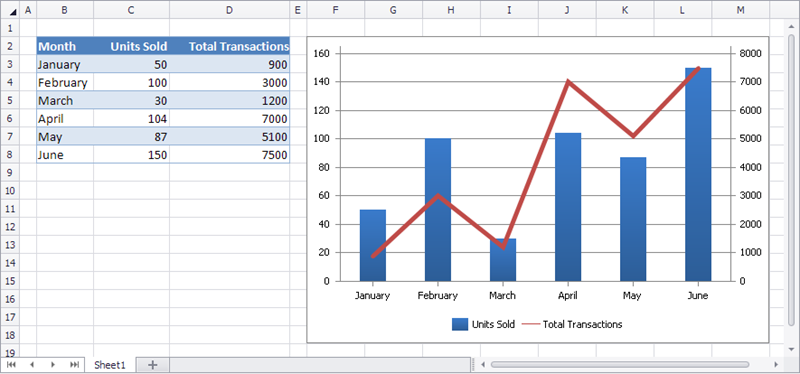
Change type of second series and use secondary axes to make chart easy to read:

chart.Series[1].ChangeType(ChartType.Line);
chart.Series[1].AxisGroup = AxisGroup.Secondary;

Chart Type

Adjust legend position and apply chart style:

chart.Legend.Position = LegendPosition.Bottom;
chart.Style = ChartStyle.ColorGradient;

Changing Legend

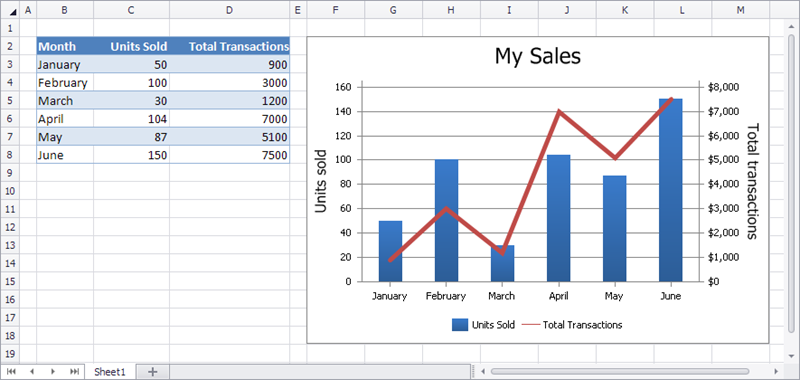
Finally setup chart title, primary and secondary value axis titles and secondary value axis number format:

chart.Title.SetValue("My Sales");
chart.PrimaryAxes[1].Title.SetValue("Units sold");
chart.SecondaryAxes[1].Title.SetValue("Total transactions");
chart.SecondaryAxes[1].NumberFormat.FormatCode = "$#,##0";
chart.SecondaryAxes[1].NumberFormat.IsSourceLinked = false;

Title and Axis Setup

Done! Notice how clean the API is to work with. This truly makes it super easy to generate any kind of spreadsheet in code.

As always, if there are any comments and/or questions, feel free to get a hold of me!

Seth Juarez
Email: sethj@devexpress.com
Twitter: @SethJuarez

Viewing all 61 articles
Browse latest View live


Latest Images